Panama Canal: El Niño Risks Raising Asia’s Energy Import Costs
The Iran War has already tightened two vital chokepoints. What if El Nino constrains a third? We believe the market is underpricing the duration of the Panama Canal freight shock due to El Nino.
Executive Summary
We believe the market is underpricing the duration of Panama Canal freight risk. Capacity is 32 daily slots, with 33 announced from 15 October; permitted draught is now 14.94m. Our base case assumes renewed tightening to roughly 28-30 transits per day through Q4 2026. A return towards 2023-24 conditions would increase delays, rerouting and premium auction bids.
The clearest impact should appear in Asian LNG and LPG freight and delivered prices rather than outright Brent. At 2 October, BLNG3 US Gulf-Japan LNG freight was US$59,100/day and BLPG3 Houston-Chiba was US$321.86/tonne, both below 25 September but above 4 September. We believe term pricing could still understate freight pressure if El Niño causes renewed canal restrictions and forces more cargoes to wait or reroute.
Our base case therefore places JKM at US$27-31/MMBtu, BLNG3 at US$70,000-90,000/day and BLPG3 at US$350-400/tonne through late Q4 2026. Oil remains supported at the margin, but Panama primarily affects crude through freight, petroleum-product pricing and replacement-barrel competition rather than direct production losses. Our central conclusion is that Panama is an amplifier of an already tight energy system, not the original source of the shortage.
KEY NUMBERS
US$102.70 BRENT AT 1215 GMT | US$5.3 million LPG CARRIER AUCTION BID | 3.2 mbpd OIL FLOWS THROUGH PANAMA | 33 slots/day FROM 15 OCTOBER |
EIA, Q2 2026 flows; Panama Canal Authority, 28 September 2026 advisory; Reuters, 1 September 2026; EIA, 13 March 2025 route estimate.
El Niño and Canal Capacity
The Scale and Timing of Restrictions
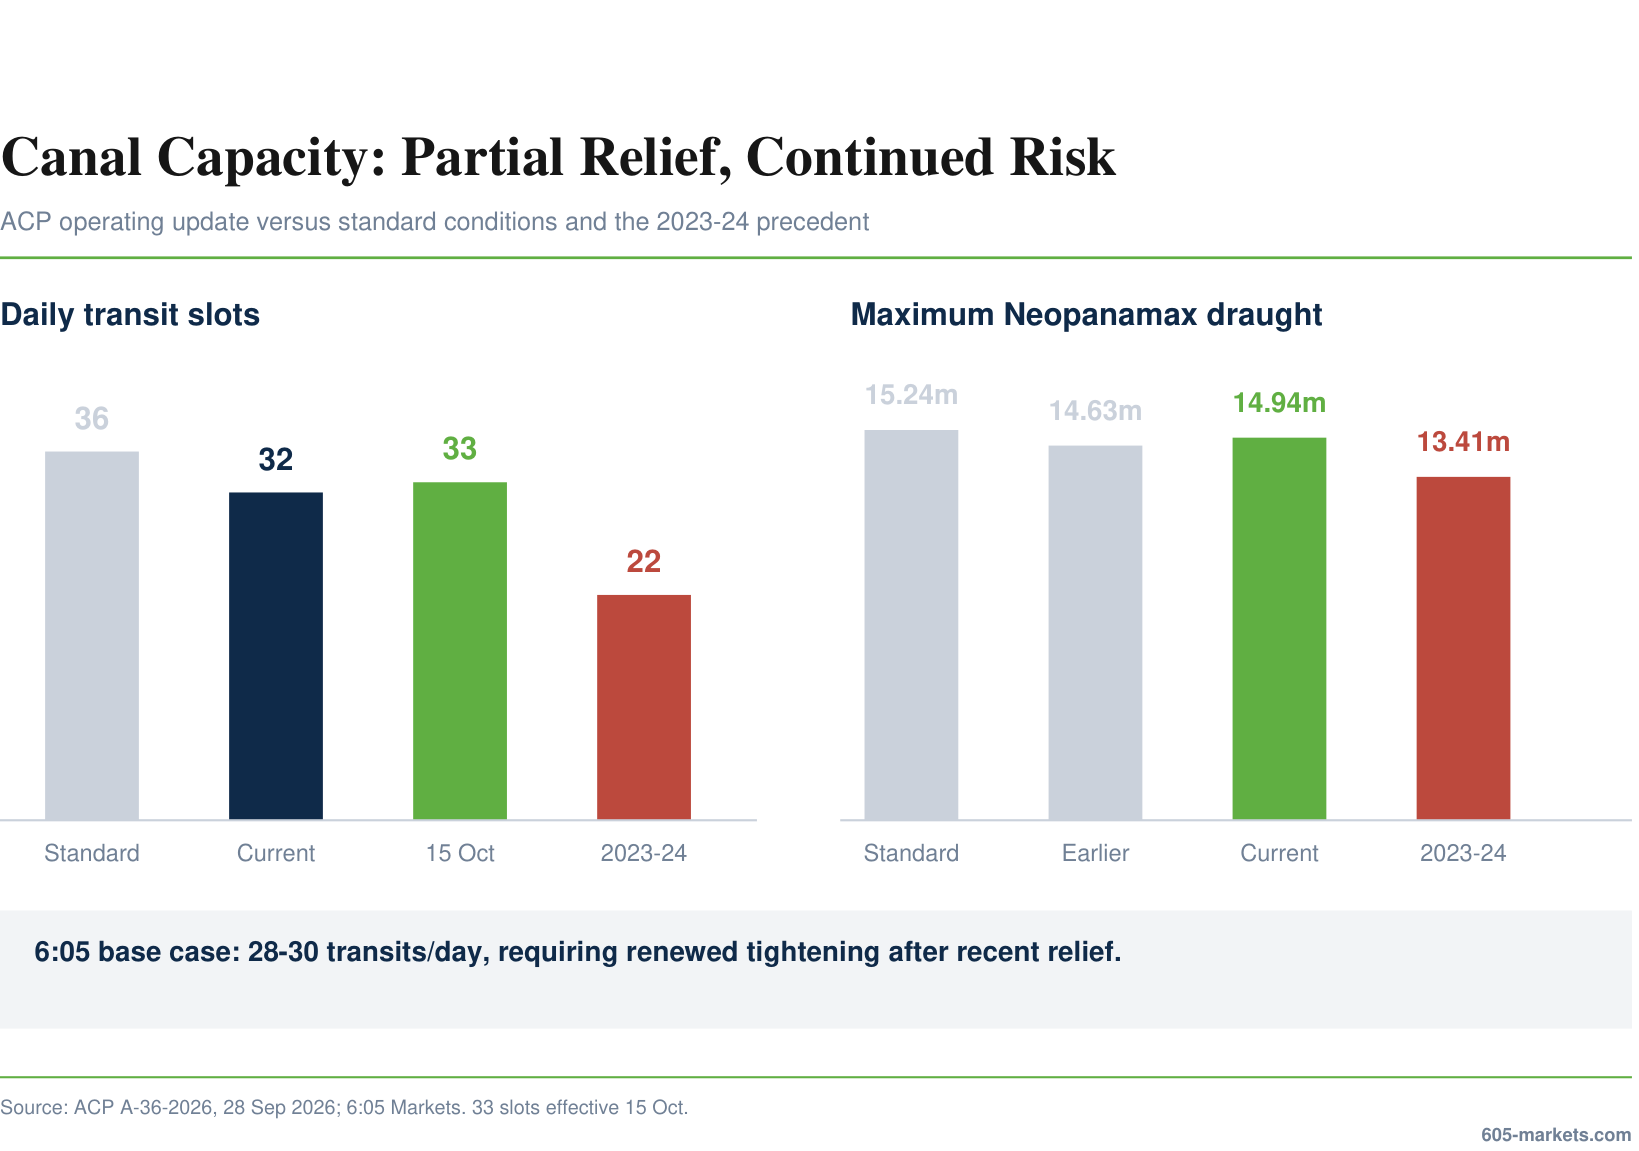
The Panama Canal Authority (ACP) reduced daily transit availability from 36 to 32 in September 2026. Its 28 September advisory announced 33 daily slots from 15 October, including ten Neopanamax slots, and raised the maximum permitted Neopanamax draught to 14.94m with immediate effect.
The planned reduction to 14.48m on 1 October was postponed. The current 14.94m limit is 30cm below the standard 15.24m, easing loading restrictions compared with the earlier 14.63m limit.
Our 28-30 daily-transit base case is an analyst forecast of renewed tightening, not ACP's announced operating plan. Recent easing weakens the near-term scarcity case; renewed drought would be needed to reverse it.
Lessons from 2023–24 El Niño
We retain the risk of renewed restrictions for two reasons: an exceptionally strong El Niño outlook and depleted watershed reserves. Rainfall from May to August 2026 was 34% below average. September rainfall and conservation measures have since allowed operational easing. Our lower-capacity scenario therefore depends on that relief proving temporary as the 2026-27 El Niño develops.
After September's cuts to 32 daily slots, ACP announced a rise to 33 from 15 October, including ten Neopanamax passages. Permitted draught rose to 14.94m on 28 September; the planned 14.48m limit for 1 October was postponed.
The climate outlook offers little relief. NOAA's Climate Prediction Center has issued an El Niño Advisory, puts the probability of a very strong event this winter above 90%, and gives a 75% chance of one that surpasses every El Niño since 1950, with the Nino-3.4 index already at +1.8°C in August. In 2023–24 El Niño transits fell to 22 per day and draft to 13.41m. Rainfall since June is below the equivalent period of the previous El Niño which deepened into the driest October since 1950 (41% below normal) and prompted cuts to as few as 18 daily slots by February 2024.
The ACP is already modelling operating scenarios for 2027, and has stated that rainfall between September and November will be decisive. The scarcity is already visible in what shippers pay for priority passage, with South Korea's SK Gas paying a record $5.3 million for an LPG tanker to transit on the 1st of September, against a median auction price of roughly $55,000 before February, while vessels without reservations face waits of around eleven days.
The Cost of Reaching Asia
Pay the Premium, Wait or Reroute
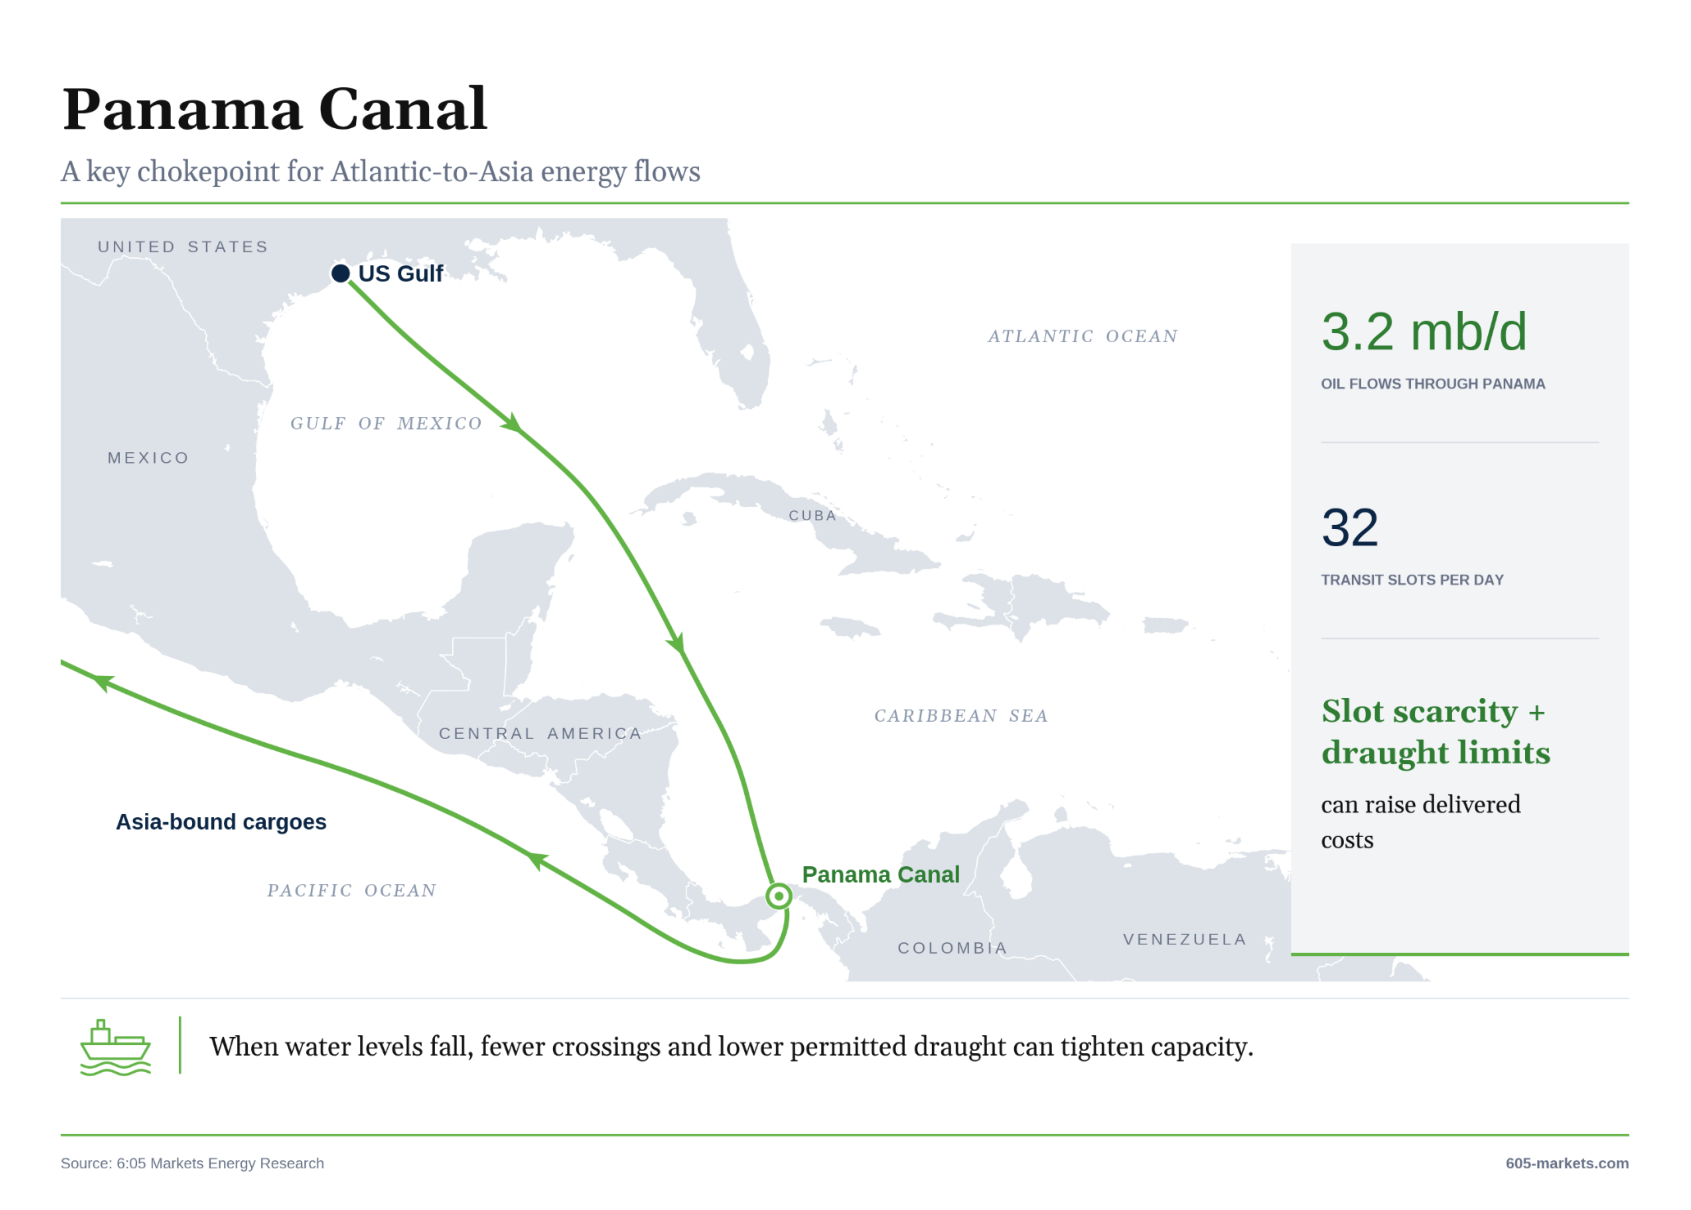
Restricted canal access results in timely delivery being more expensive. Tankers attempting to ship oil without paying for a premium slot to guarantee timely delivery must either compete for the remaining slots, accept a later transit date, or reroute through the Cape of Good Hope. However, a key distinction to be made is that auction premiums purchase access rather than replace the standard canal toll, and most vessels book ahead. Rerouting around the Cape of Good Hope avoids Panama but increases sailing time. The EIA estimates that US Gulf-East Asia propane shipments take approximately one month through Panama, with the Cape route adding around two weeks. Longer voyages incur additional vessel hire and fuel costs, partly offset by avoided canal charges.
OPTIONS | WHAT’S CHANGED? | WHAT HAS TO BE PRICED IN? |
|---|---|---|
Secure a premium slot | Higher access cost, with a confirmed transit date | Additional booking/auction expense above the normal arrangement. |
Wait for passage | Later delivery, with uncertain scheduling | Additional vessel time, waiting fuel and applicable cargo or contractual costs. |
Reroute through Cape of Good Hope | Longer sailing distance and time taken, but doesn’t have to go through Panama Canal | Additional vessel time and fuel, less avoided canal charges, with cargo and scheduling adjustments. |
Why Paying the Premium Can Still Make Sense
The size of recent auction bids should not be confused with the normal cost of crossing the canal. Under the published tariff, a 3.9 million MMBtu LNG carrier would face a base toll of roughly US$648,500, while an 84,000 m³ LPG carrier would pay roughly US$531,000, before booking charges and other services. The US$5.3 million paid by G. Spirit in September therefore represents an exceptional scarcity premium for securing immediate passage rather than the standard cost of transit.
Net additional cost allocated to the cargo | LNG: US$/MMBtu | LPG: US$/tonne | Oil: US$/barrel |
|---|---|---|---|
US$250,000 | 0.06 | 5.56 | 0.50 |
US$1,000,000 | 0.26 | 22.22 | 2.00 |
US$4,000,000 – High case | 1.03 | 88.89 | 8.00 |
Cargo assumptions: LNG 3.9m MMBtu; LPG 45,000 tonnes; oil 500,000 barrels.
The decision to pay such a premium depends on the value of time. A vessel can avoid the auction by waiting or rerouting, but neither alternative is free. Waiting delays the cargo and leaves the delivery date uncertain, while a Cape diversion increases sailing distance and ties the vessel up for longer. For a cargo with a fixed delivery commitment, or where the destination market is temporarily offering a sufficiently large premium, paying several million dollars for certainty can therefore be economically preferable to arriving weeks later. The three options should be treated as competing alternatives rather than additive costs.
Higher Delivery Costs and Tighter Vessel Availability
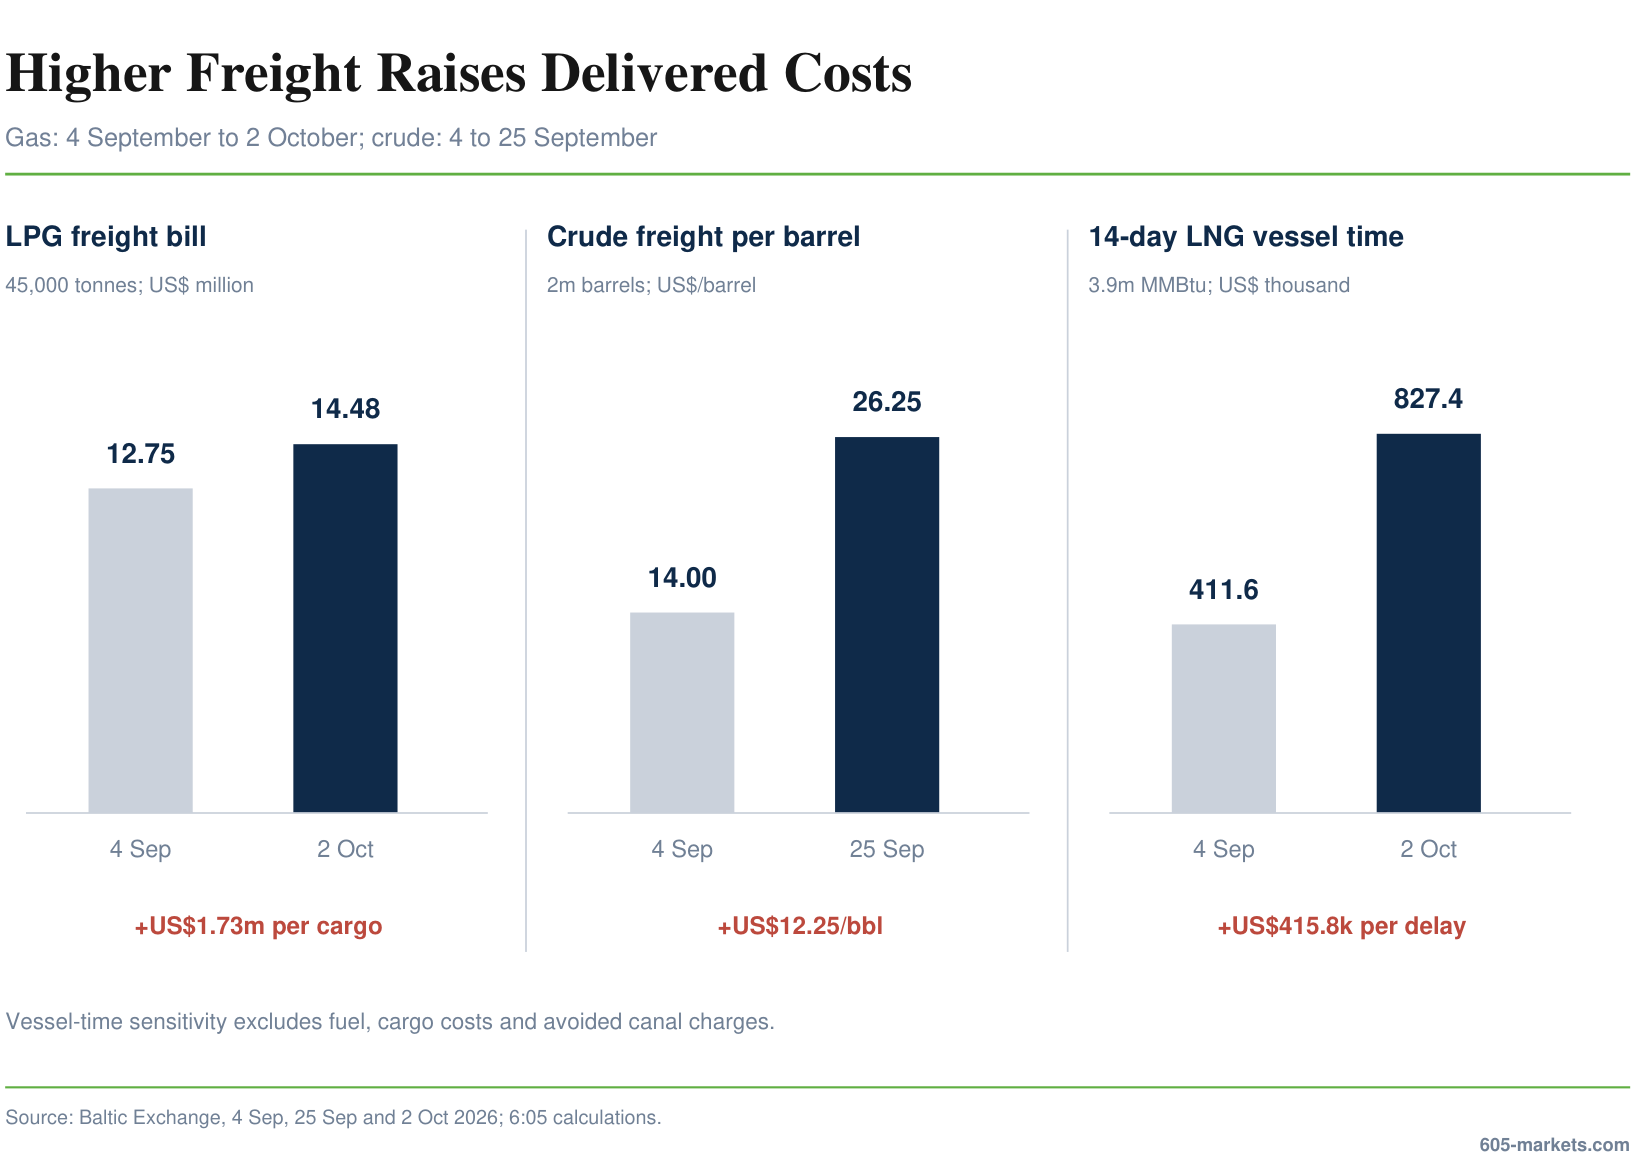
Shipping costs rose sharply in September, especially on routes supplying Asia. Between the Baltic Exchange reports dated 4 and 25 September 2026, BLNG3 US Gulf-Japan LNG freight rose from US$29,400/day to US$66,000/day, a 124.5% increase over three weeks. Over the same period, BLPG3 Houston-Chiba rose from US$283.33/tonne to US$324/tonne, up 14.4%. For a 45,000-tonne LPG cargo, the freight bill rose from about US$12.75 million to US$14.58 million, an increase of US$1.83 million. Gas freight has since eased slightly; we use 2 October assessments below.
Crude shipping also strengthened over the same 4-25 September period. Middle East Gulf-China VLCC round-trip TCE rose from approximately US$704,000 to US$1.235 million/day, around 75.4%. The increase extended beyond Middle Eastern loading ports: US Gulf-China voyage freight climbed from approximately US$28 million to US$52.5 million, up 87.5%. For an assumed two-million-barrel shipment, that is equivalent to freight rising from US$14 to US$26.25/barrel, before any change in the underlying crude price.
These VLCC figures provide wider oil-shipping context rather than a direct Panama exposure, as fully laden VLCCs do not transit the canal.
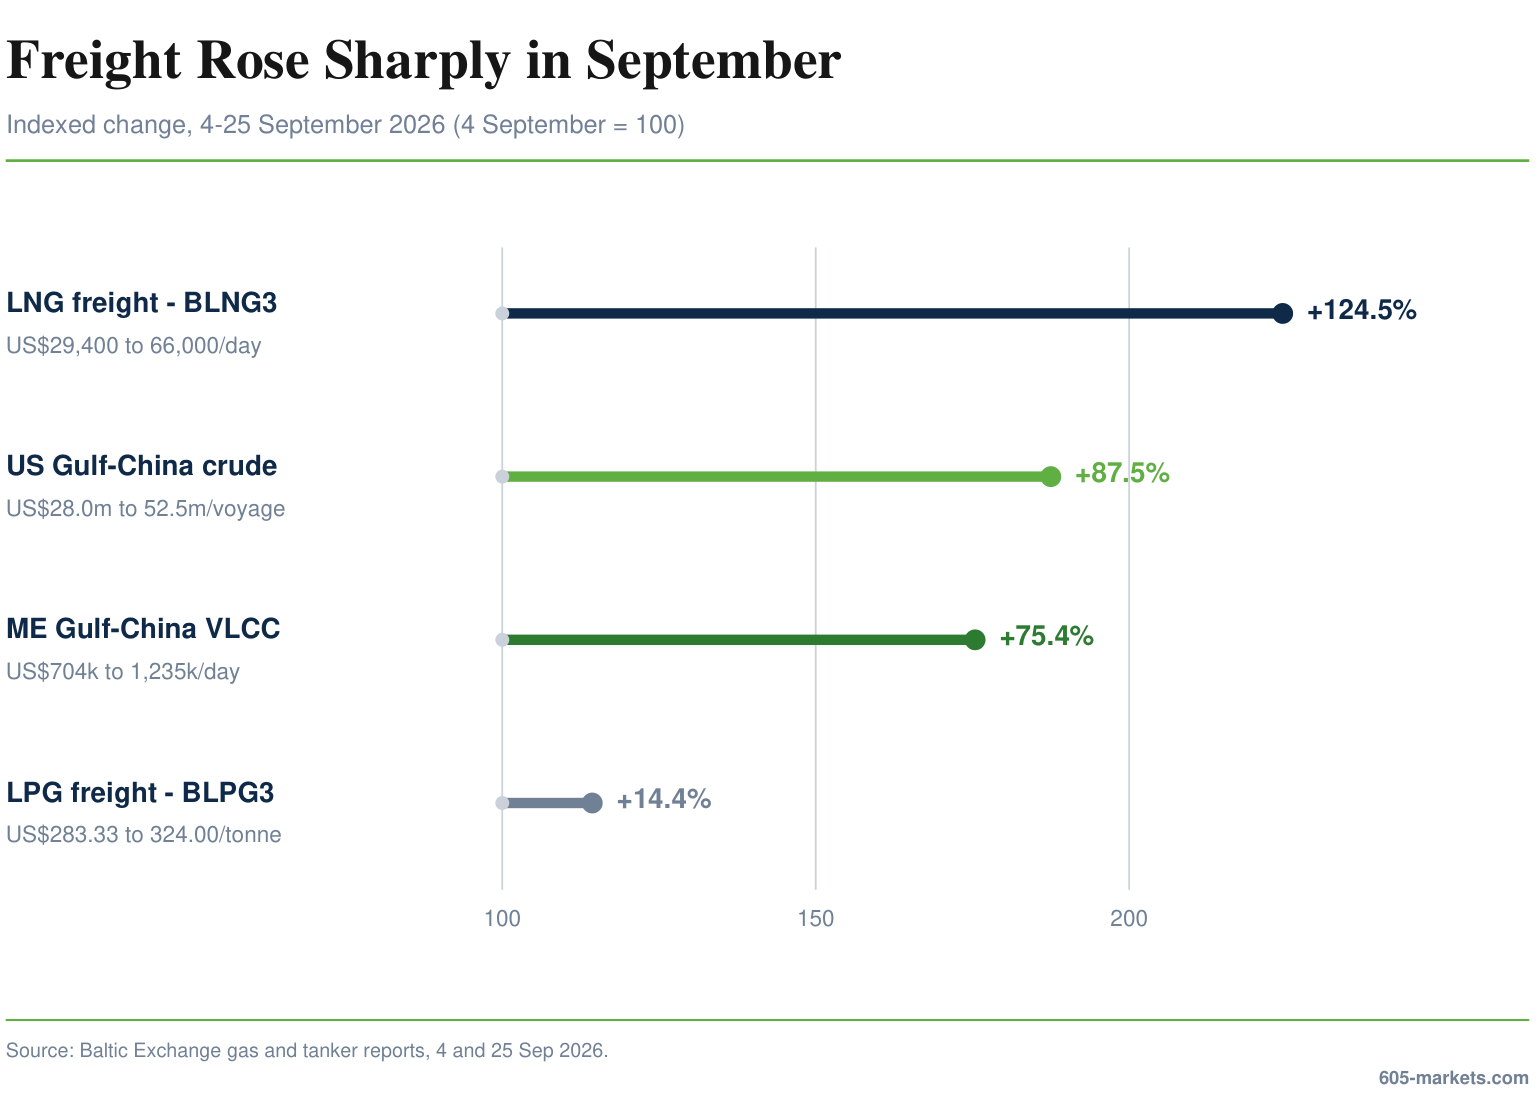
The September reports highlighted limited ship availability, with different drivers across markets. Seasonal demand supported LNG freight. Meanwhile, more profitable work in the Middle East is keeping LPG carriers away from the US Gulf. Panama restrictions and longer journeys around the Cape are also pushing up LPG shipping costs. Vortexa separately reported that ship-to-ship transfer operations near Hormuz were taking approximately ten days, versus five to seven previously. These examples show how moving cargo through a more complicated transport system can require more ships, without a corresponding increase in the quantity ultimately consumed.
At the 2 October BLNG3 assessment, an additional delay still carries a higher vessel-time cost than in early September. For a fourteen-day extension, estimated hire rises from US$411,600 at US$29,400/day to US$827,400 at US$59,100/day. That is US$415,800 more for the same delay. Across a 3.9 million MMBtu cargo, the vessel-time component rises from about US$0.11 to US$0.21/MMBtu. This sensitivity is not an all-in rerouting quote: fuel and cargo-related costs must still be added, and avoided canal charges deducted.
Methodology Note: Insurance and Security Risk
A separate yet relevant point is war-risk insurance. Additional insurance charges depend on the vessel’s exposure to dangerous waters and its insurance and charter terms. Neither El Niño nor a longer voyage around the Cape automatically creates a war-risk surcharge. Our route comparison therefore includes additional insurance only where the actual voyage requires it, without adding charges already included in quoted freight.
Our Position, Pricing and Risks
Our View Versus Market Pricing
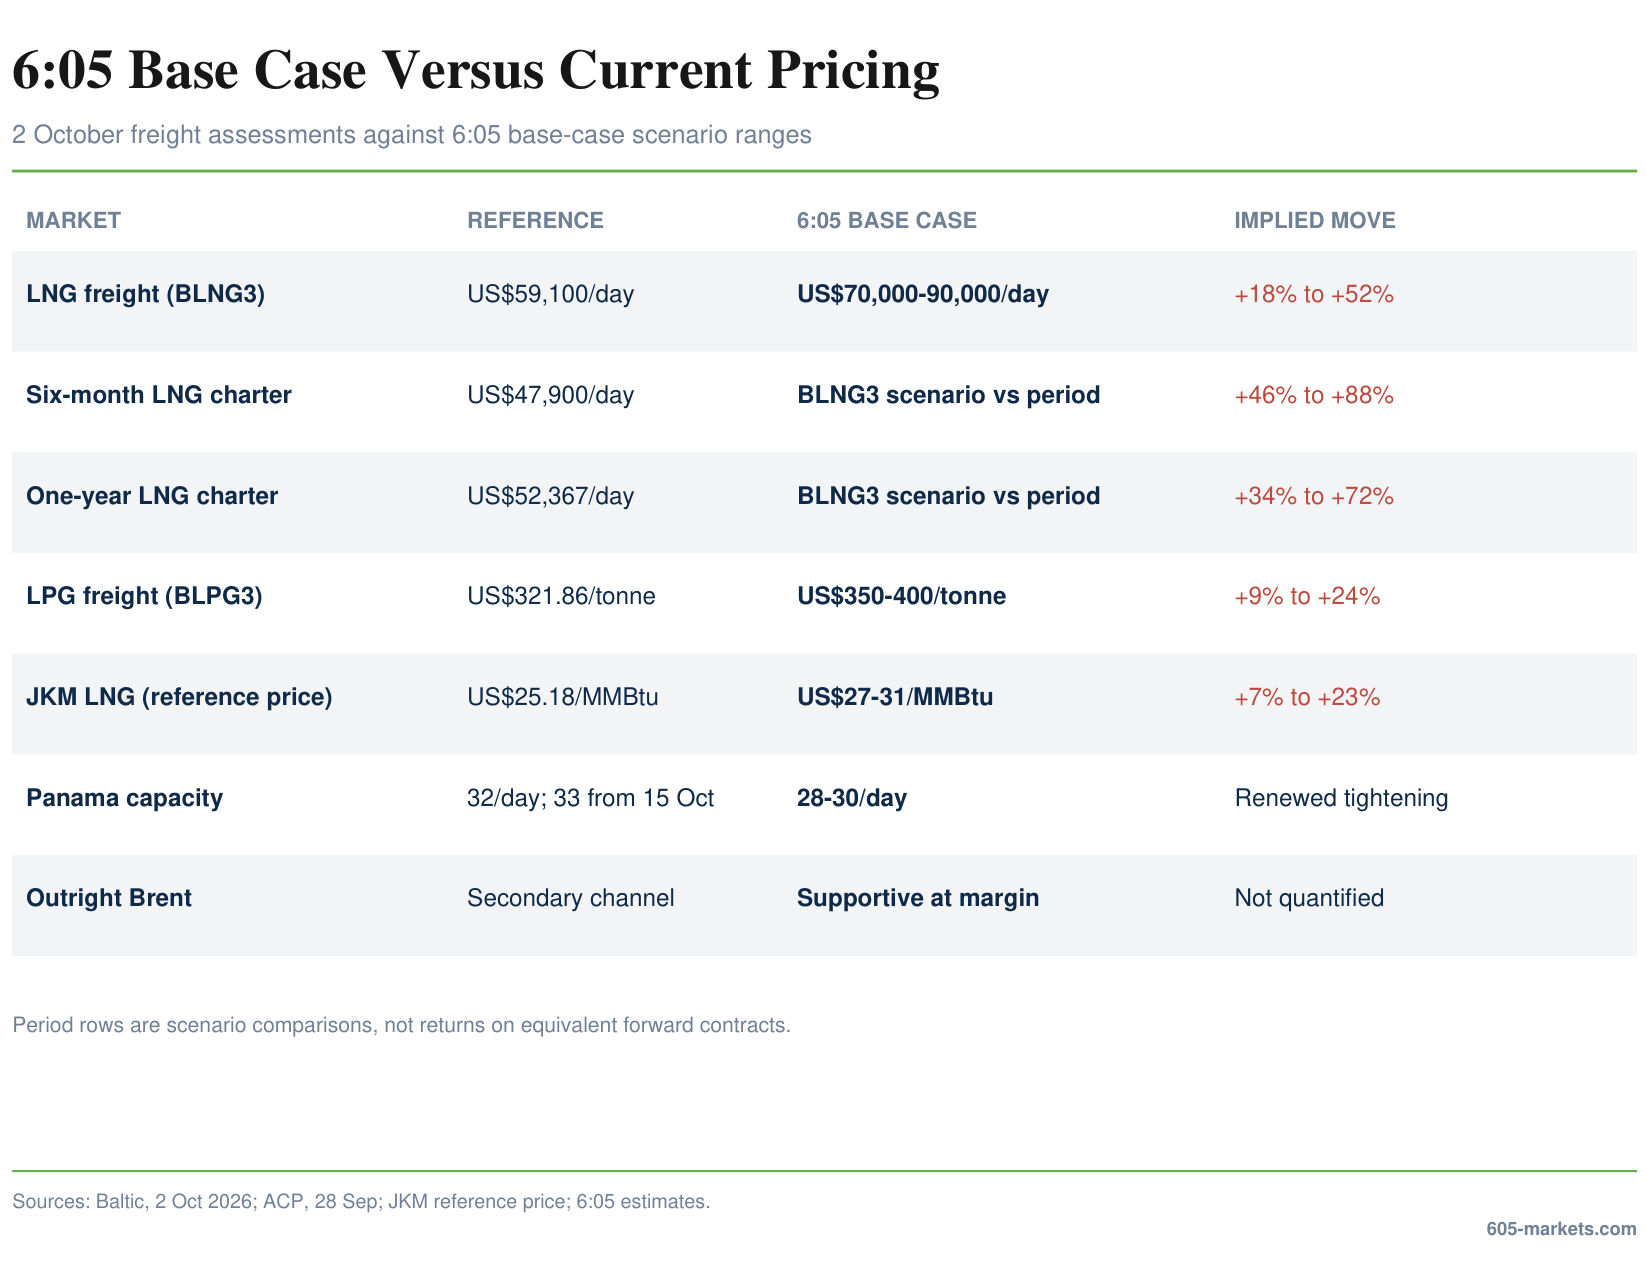
Our central view is that the largest potential mispricing is in the cost of delivering energy into Asia if Panama constraints return. On 2 October, BLNG3 was US$59,100/day and BLPG3 US$321.86/tonne. Both had eased from 25 September, although they remained above early-September levels. Baltic's six-month LNG time-charter assessment was US$47,900/day, about 19% below BLNG3 spot; the one-year assessment was US$52,367/day, about 11% below spot.
The gap has narrowed since 25 September. We still see upside if renewed canal restrictions outlast the recent operational relief. ACP has raised permitted draught to 14.94m and announced 33 daily slots from 15 October, versus 32 currently and 36 under normal conditions. Our 28-30 transit forecast therefore assumes renewed tightening later in Q4.
Spot and period charter assessments provide a pricing comparison, not a like-for-like forward forecast for BLNG3. Our US$70,000-90,000/day base case is about 18-52% above current spot. The strongest impact should still appear in LNG/LPG freight and Asian delivered prices; outright Brent remains a secondary channel unless global oil supply deteriorates.
The Marginal Cargo Sets the Asian Price
This matters because the marginal cargo sets the price. A US$0.25–1.00/MMBtu logistics increase does not mechanically move JKM by the same amount, but if Asian inventories are being drawn and replacement cargoes are scarce, the buyer may need to offer substantially more than the transport cost simply to divert the next cargo from Europe or another destination. We therefore view the Panama shock as capable of amplifying an already tight LNG market rather than independently creating the entire price increase.
LNG and Freight Carry the Clearest Upside
Our JKM reference price is US$25.18/MMBtu. Our base case places JKM at US$27-31/MMBtu through late Q4 2026 if Panama restrictions persist alongside the existing Middle East and winter-demand backdrop. A sustained move above US$30/MMBtu is therefore plausible, but it is not our forecast from Panama alone: it requires both higher delivery costs and continued competition for physical LNG cargoes.
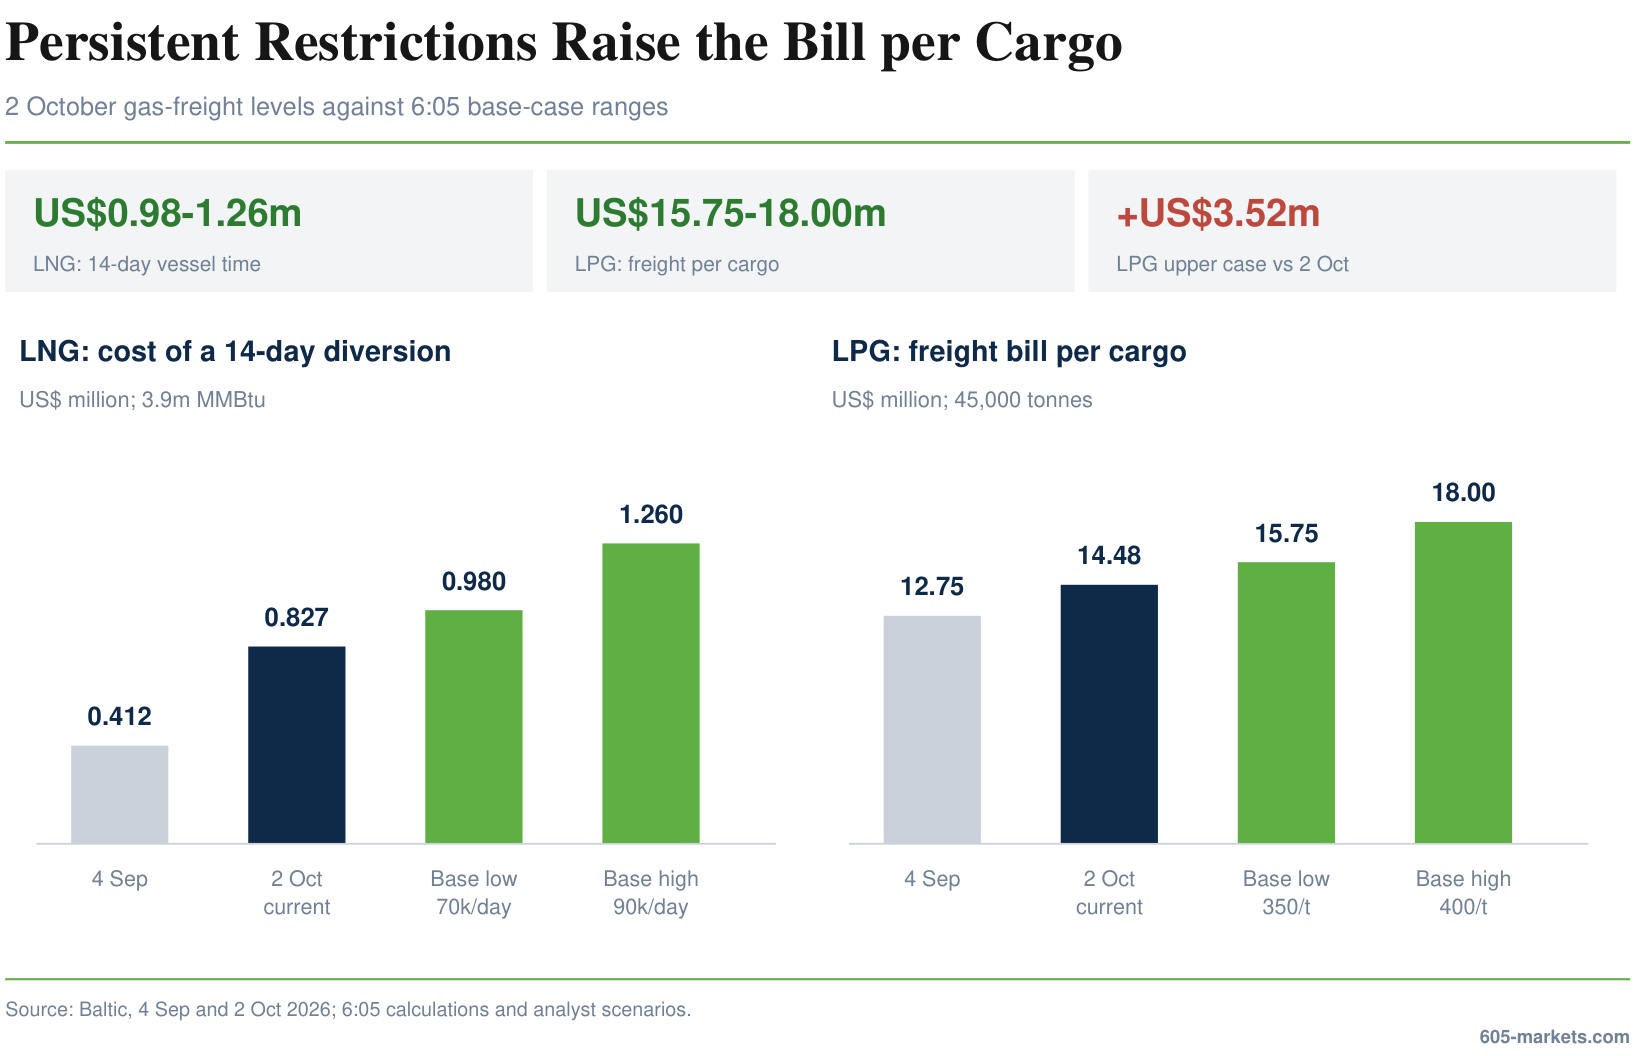
Our strongest conviction is in freight. We expect BLNG3 to remain structurally above the six-month Baltic assessment while canal capacity is constrained, with a US$70,000–90,000/day base-case range. At US$80,000/day, a fourteen-day diversion alone ties up US$1.12 million of vessel time; at US$90,000/day, the same delay reaches US$1.26 million.
LPG Is Even More Directly Exposed
LPG is even more directly exposed. BLPG3 was US$321.86/tonne on 2 October. We see US$350-400/tonne as a reasonable base-case range under persistent restrictions. For a 45,000-tonne cargo, US$350/tonne implies US$15.75 million of freight, while US$400 implies US$18.0 million, compared with approximately US$14.48 million at US$321.86/tonne on 2 October. The upper end would therefore add roughly US$3.52 million per cargo relative to current freight.
Oil Is a Secondary Transmission Channel
Oil is different. Panama carries material petroleum volumes, but much of the canal's relevance is to petroleum products and smaller vessels rather than fully laden VLCC crude flows. We therefore expect the initial effect to appear in freight, regional product prices and export netbacks, rather than an immediate one-for-one increase in Brent. Panama is supportive of crude prices at the margin, but Middle East production, Hormuz flows and global inventories remain much larger drivers of outright Brent.
Forecast Method. Our scenario ranges are 6:05 Markets analyst estimates anchored to the 2 October Baltic freight and period-charter assessments, our JKM reference price, observed 2023-24 Panama conditions and the cargo-cost sensitivities calculated earlier. They are not outputs from a probability-weighted shipping model. The ranges represent prices we believe are consistent with each physical canal scenario rather than point forecasts.
Parameter | 6:05 Markets View |
|---|---|
Direction | Bullish Asian LNG/LPG delivered costs and freight; modestly supportive outright oil |
Primary horizon | Q4 2026 |
Highest-conviction exposure | BLNG3, BLPG3 and JKM rather than outright Brent |
Base JKM range | US$27–31/MMBtu |
Base BLNG3 range | US$70,000–90,000/day |
Base BLPG3 range | US$350–400/tonne |
Panama assumption | ~28-30 daily transits if recent easing reverses; above 2023-24 lows |
Analytical confidence | Medium-high on freight; medium on LNG/LPG prices |
Scenarios and Expected Outcomes
Recovery
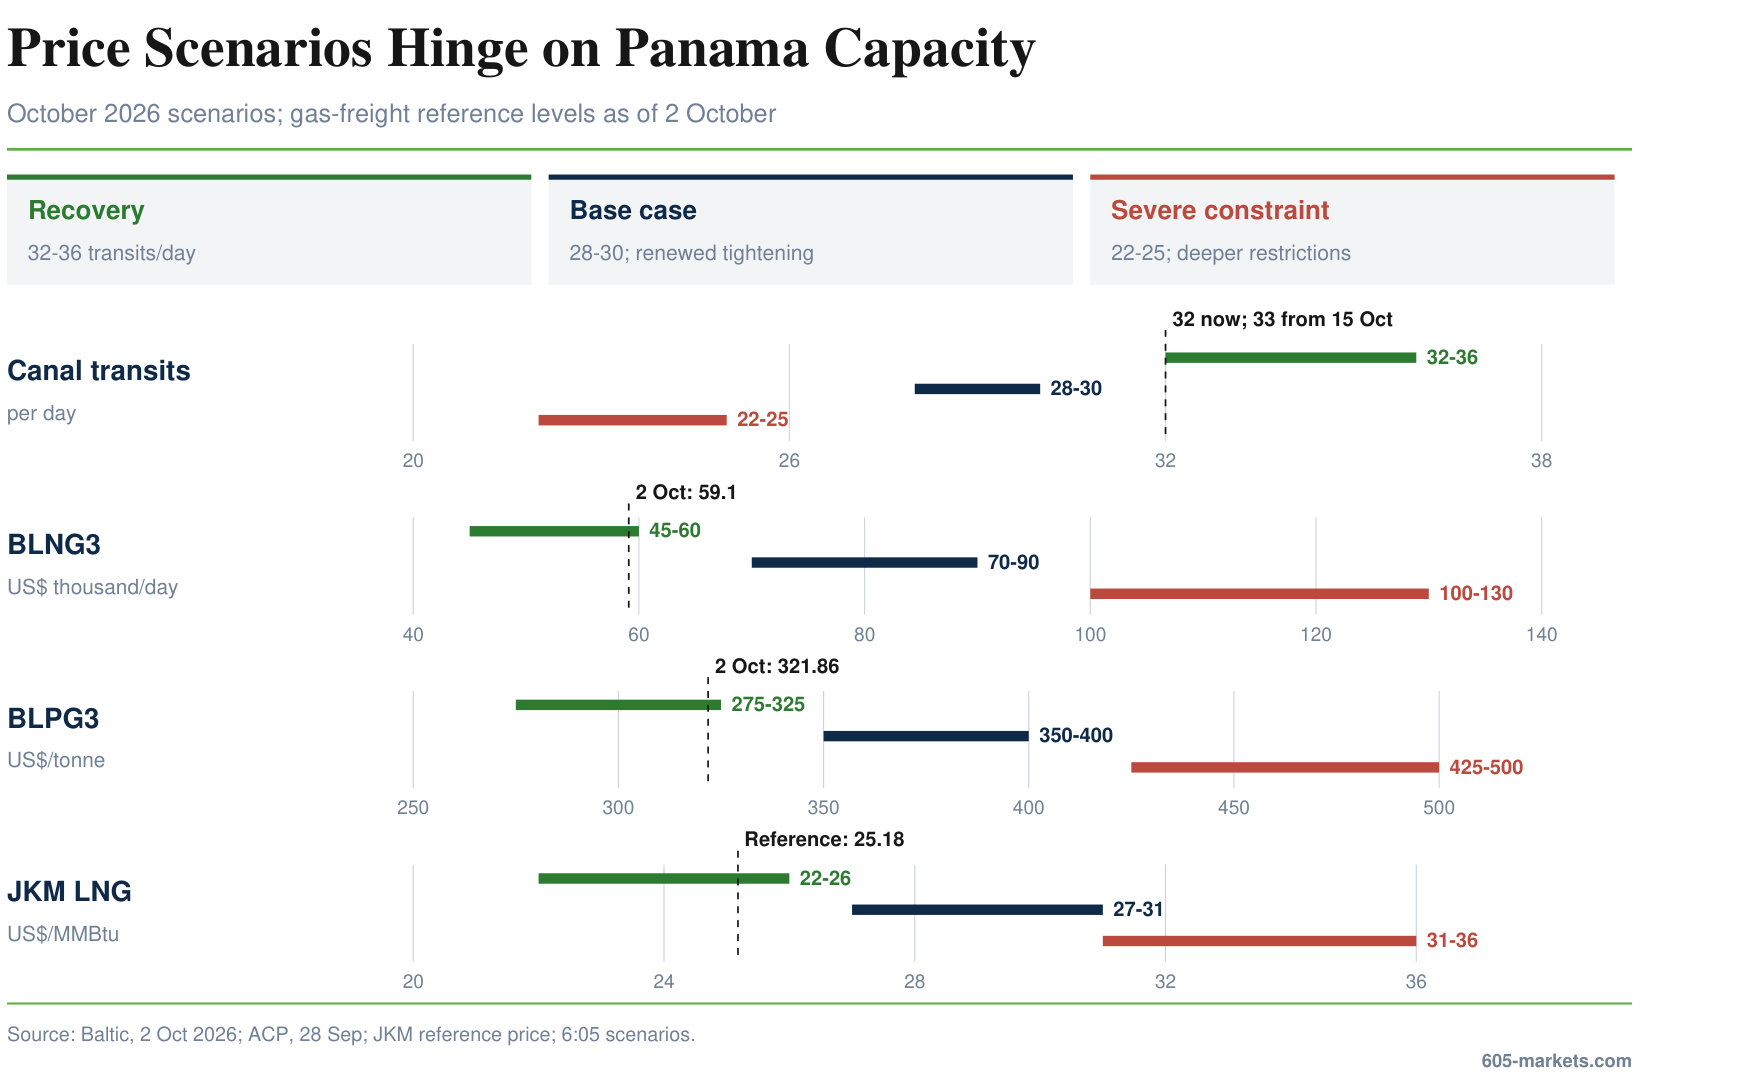
The recovery case requires recent improvements in rainfall and water levels to persist, allowing capacity to rise towards 32-36 daily transits and vessel availability to improve. ACP's announced 33 slots from 15 October and 14.94m draught show movement in this direction. Lower auction premiums would keep more cargoes on Panama. BLNG3 at US$59,100/day on 2 October already lies within the US$45,000-60,000/day recovery range. JKM could move towards US$22-26/MMBtu if winter demand is weaker or Middle Eastern supply improves. El Niño need not disappear; operating conditions need only ease enough to reduce competition for slots.
Base Case
Our base case assumes recent operational relief proves temporary and canal capacity tightens again to average 28-30 transits per day through Q4, versus 36 under normal conditions and above the 22/day lows of 2023-24. Auction premiums stay elevated, some cargoes reroute and LNG/LPG vessel availability remains tight.
Under this scenario, we expect BLNG3 at US$70,000-90,000/day, BLPG3 at US$350-400/tonne and JKM at US$27-31/MMBtu, implying roughly 7-23% upside from the US$25.18 reference. Higher transport costs, tighter vessel availability and competition for marginal cargoes drive the move.
Severe Constraint
The upside case is a return towards 22–25 transits per day, forcing more vessels to wait, reduce cargo or reroute. Repeated auction premiums above US$2 million would become more plausible, with the observed US$5.3 million bid no longer looking exceptional. A US$5 million premium equates to roughly US$1.28/MMBtu on a 3.9 million MMBtu LNG cargo or US$111/tonne on a 45,000-tonne LPG cargo. Under this scenario, we expect BLNG3 at US$100,000–130,000/day, BLPG3 at US$425–500/tonne and JKM at US$31–36/MMBtu, or roughly 23–43% upside from US$25.18.
For crude, the effect should be smaller and less direct. We estimate roughly US$3–6/bbl of incremental support in an otherwise unchanged global balance, mainly through freight, products and replacement-barrel competition rather than lost crude production.
What Would Change Our View?
Bullish case weakens materially if:
- The announced 33 daily slots from 15 October are delivered and sustained.
- Maximum permitted draught remains at the restored 14.94m or improves further, allowing vessels to move with smaller loading penalties.
- Typical auction premiums fall back towards US$250,000-300,000 or below, indicating that access is no longer scarce.
- BLNG3 falls below approximately US$50,000/day for two consecutive weeks.
- BLPG3 falls below approximately US$300/tonne despite continuing Panama restrictions.
- JKM trades below US$23/MMBtu, indicating that demand weakness or alternative supply is overwhelming the logistics constraint.
Our thesis position strengthens if:
- Daily transit availability falls below approximately 27 vessels, especially towards the 2023-24 level of 22.
- Draught restrictions approach 13.4-14.0 metres.
- Million-dollar auction premiums become recurring rather than exceptional.
- BLNG3 breaks US$90,000/day or BLPG3 exceeds US$400/tonne.
- US Gulf-Asia cargoes begin routinely diverting around the Cape rather than doing so opportunistically.
- JKM moves above US$30/MMBtu while the Middle East supply situation is broadly unchanged. That would provide much cleaner evidence that freight and Panama constraints themselves are being transmitted into Asian delivered prices.
What Could Break the Base Case?
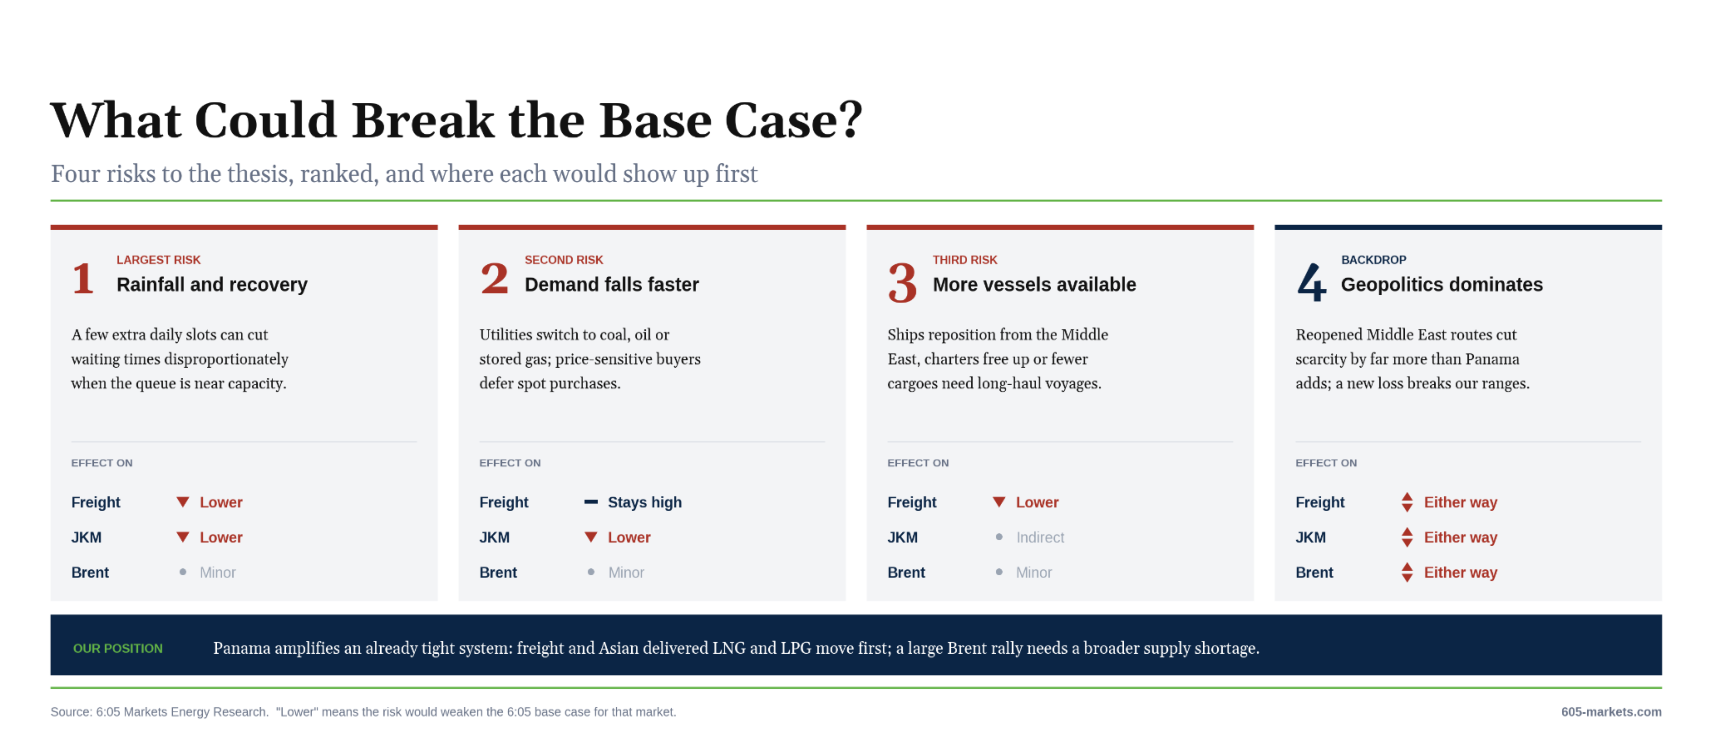
The largest risk is that recent rainfall improvement and operational recovery persist. Panama need not return fully to normal for the thesis to weaken: even a few additional daily slots can reduce waiting times disproportionately when the vessel queue is near capacity.
The second primary risk is demand decreasing at a faster rate than shipping capacity. Higher LNG prices encourage utilities to burn coal, oil or stored gas where possible, while price-sensitive Asian importers can defer spot purchases. If demand falls faster than shipping capacity, the cost of freight can remain high without producing the expected rise in JKM.
Third, increased vessel supply can solve part of the problem. Current freight strength reflects scarce available tonnage as much as the Panama Canal itself. If vessels reposition from the Middle East, charter availability improves or fewer cargoes require long-haul journeys, BLNG3 and BLPG3 can fall even while canal restrictions remain.
Finally, the broader geopolitical backdrop can dominate the Panama effect. A meaningful reopening of Middle Eastern supply routes would reduce oil and LNG scarcity by substantially more than Panama restrictions add to transport costs. Conversely, another major Middle Eastern supply loss could push prices well above our severe-case ranges while making it impossible to attribute the move primarily to Panama.
Our position is therefore specific: Panama is an increasingly important amplifier of an already tight energy-shipping system. We expect the strongest effect to appear first in freight and Asian delivered LNG/LPG prices, while a large outright Brent rally requires a broader physical supply shortage.
Conclusion
The Panama Canal remains an additional constraint on a tight energy system, but its latest operating update brings partial relief. Capacity is 32 daily slots, with 33 announced from 15 October, while maximum permitted draught has increased to 14.94m. Our base case assumes renewed tightening to 28-30 transits per day through Q4. That view depends on the recent rainfall and operating improvement proving temporary. Longer Cape diversions would then absorb vessel capacity and raise delivery costs. Under this scenario, we retain JKM at US$27-31/MMBtu, BLNG3 at US$70,000-90,000/day and BLPG3 at US$350-400/tonne through late Q4 2026. Oil remains supported at the margin through freight, regional products and replacement-barrel competition; a sustained Brent rally still requires a broader physical supply shortage.
Panama is an amplifier, not the original source of the energy shortage. El Niño could tighten a route made more valuable by pressure on alternative supply and shipping channels. If the announced 33 daily slots and restored 14.94m draught are sustained, or freight and JKM fall despite remaining restrictions, the thesis weakens. If transits fall towards the low-20s, million-dollar auction premiums become recurring and US Gulf cargoes increasingly reroute around the Cape, the market would need to price a more persistent logistics shock.
The core question is therefore whether recent operational relief lasts. Our bullish scenario requires renewed constraints; the latest canal and freight data must be weighed against that forecast.
By end of Q4 2026, BLPG3 will be between US$350–400/tonne.
Series LPG Freight Route US Gulf to Japan (BLPG3) (Baltic) Futures Entry 302.77 Range between 350.00 and 400.00 By 31 Dec 2026 Written 5 Oct 2026
Resolves against the readings entered for BLPG3 on the last observation on or before 31 Dec 2026. Not investment advice.
By end of Q4 2026, BLNG3 will be between US$70,000–90,000/day.
Series Baltic Exchange BLNG3 (US Gulf to Japan LNG freight route) spot rate Entry 59100.00 Range between 70,000.00 and 90,000.00 By 31 Dec 2026 Written 5 Oct 2026
Resolves against the readings entered for BLNG3 on the last observation on or before 31 Dec 2026. Not investment advice.
By end of Q4 2026, JKM will be in the range ofUS$27–31/MMBtu.
Series Liquefied Natural Gas Japan Korea Entry 25.71 Range between 27.00 and 31.00 By 31 Dec 2026 Written 5 Oct 2026
Resolves against the readings entered for JKMX6 (Globex CME) on the last observation on or before 31 Dec 2026. Not investment advice.