Kazakhstan vs Uzbekistan 2030s: A Central Asian Sovereign Relative Value Trade
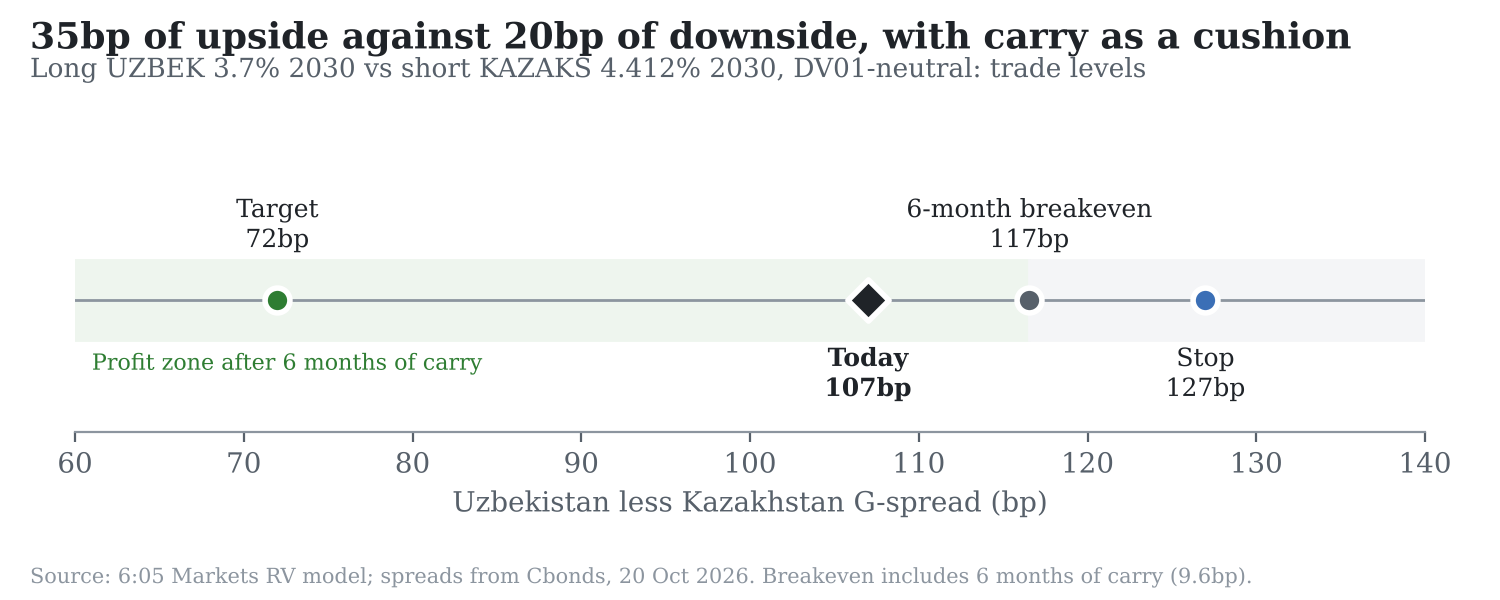
We recommend going long on the Uzbekistan 3.7% 2030s against the Kazakhstan 4.412% 2030s on a DV01-neutral basis. At 159bp and 52bp over Treasuries respectively, the differential stands at 107bp, and we target compression to 72bp, with a stop at 127bp, over a 12 to 24 month horizon.

Executive Summary
We recommend going long on the Uzbekistan 3.7% 2030s against the Kazakhstan 4.412% 2030s on a DV01-neutral basis. At 159bp and 52bp over Treasuries respectively, the differential stands at 107bp, and we target compression to 72bp, with a stop at 127bp, over a 12 to 24 month horizon. Kazakhstan's re-rating is largely complete: its 2030s priced inside Poland and Qatar at issue and have tightened a further 33bp since S&P's upgrade to BBB, leaving little to drive spreads tighter. Uzbekistan, by contrast, has received six positive rating actions in fifteen months, and Fitch's positive outlook points towards BB+. With debt of roughly 32% of GDP against a BB median of 54%, its fundamentals already justify a stronger rating, and a one-notch upgrade across the agencies is worth 30 to 35bp of compression.
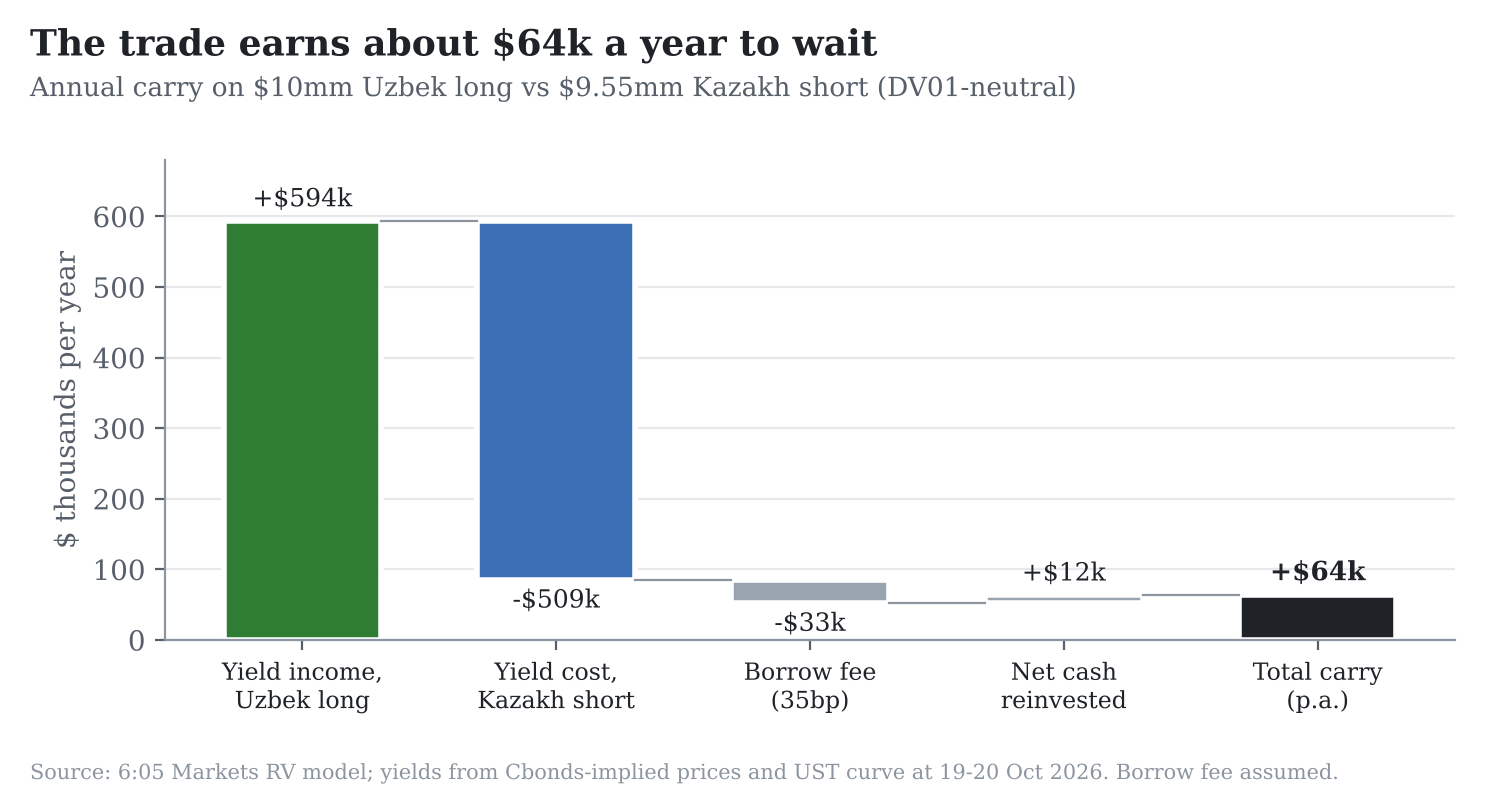
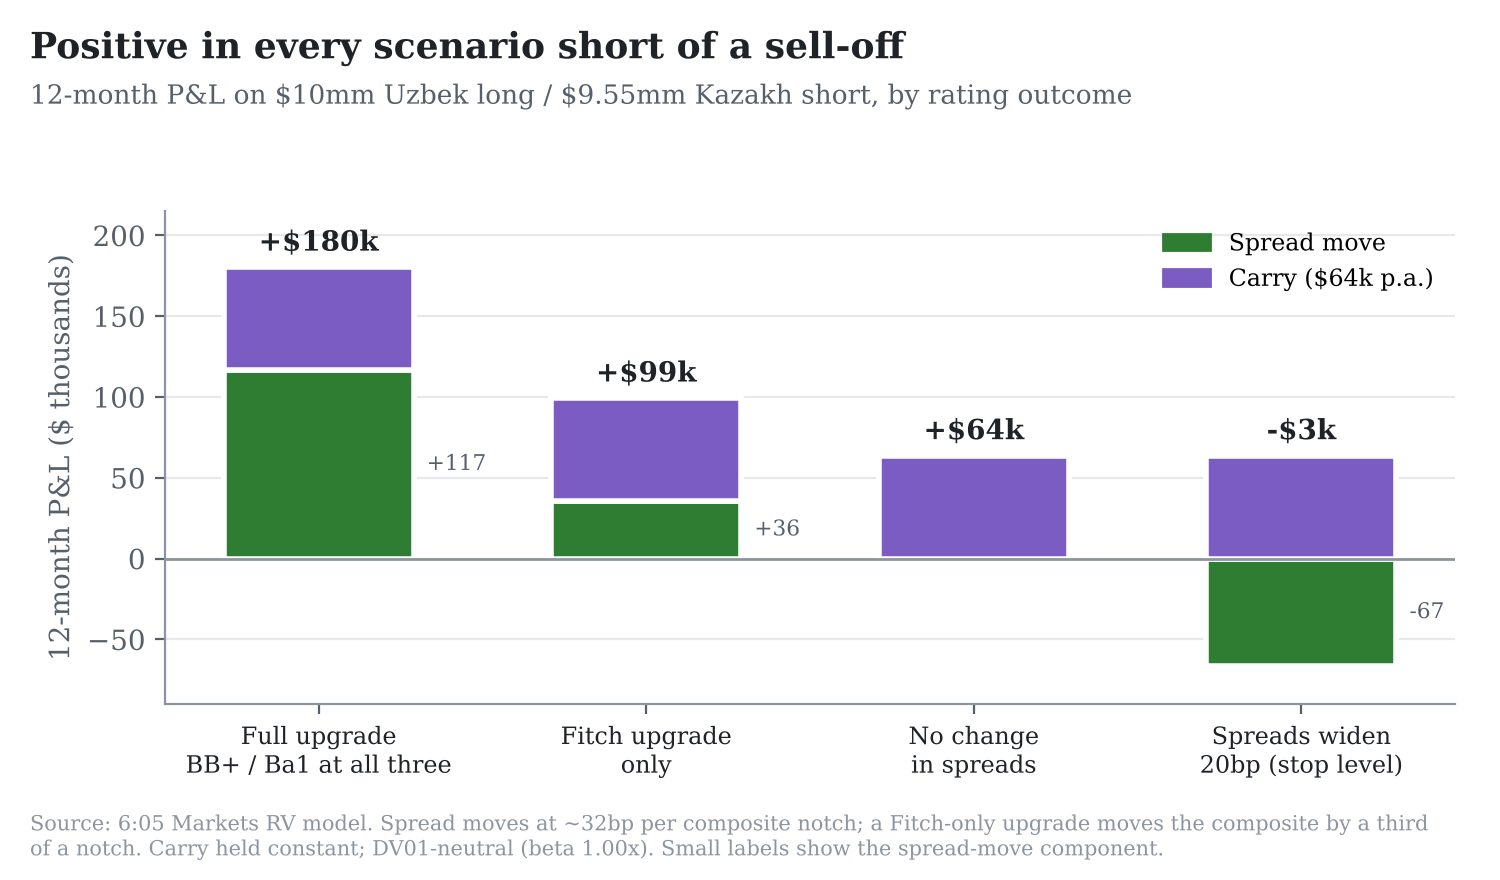
On a $10mm Uzbek long against a $9.55mm Kazakh short, the position earns around $64k a year in carry. That leaves it profitable in every scenario short of a broad sell-off, and offers roughly four times the reward to risk at our target and stop. The principal risks are an oil rally tightening Kazakh spreads, heavy new Uzbek supply, and a risk-off move in which high-yield credit underperforms. We manage these through the stop and, where warranted, a higher hedge ratio on the Kazakh leg.
Introduction
Trade Summary
We recommend buying $10mm of Uzbekistan’s 3.7% 2030 bond and selling short $9.55mm of Kazakhstan’s 4.412% 2030 bond. The sizes make the trade DV01-neutral (around $3,334 per bp on each leg), so moves in US Treasury yields cancel out and only the gap between the two spreads matters.
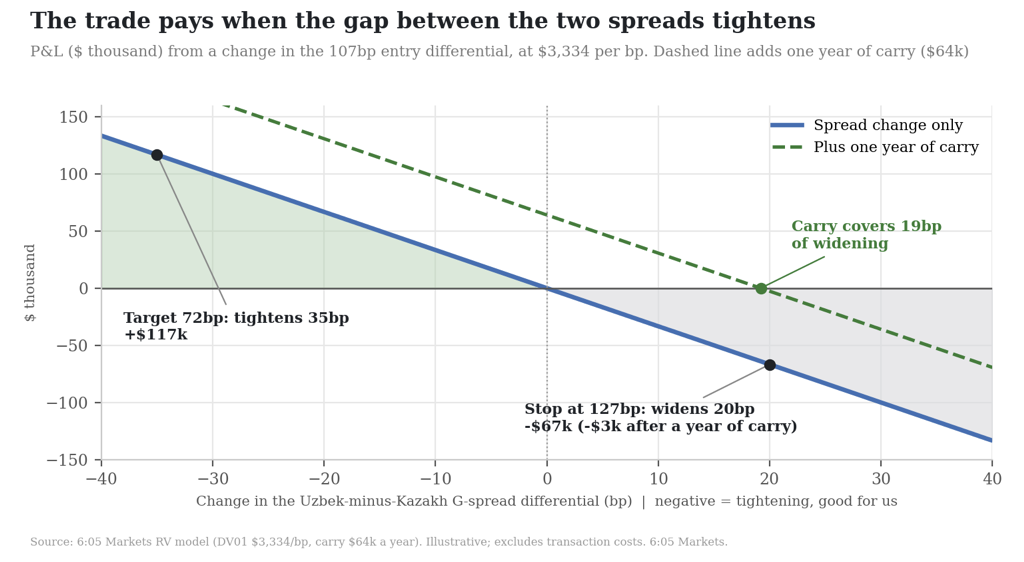
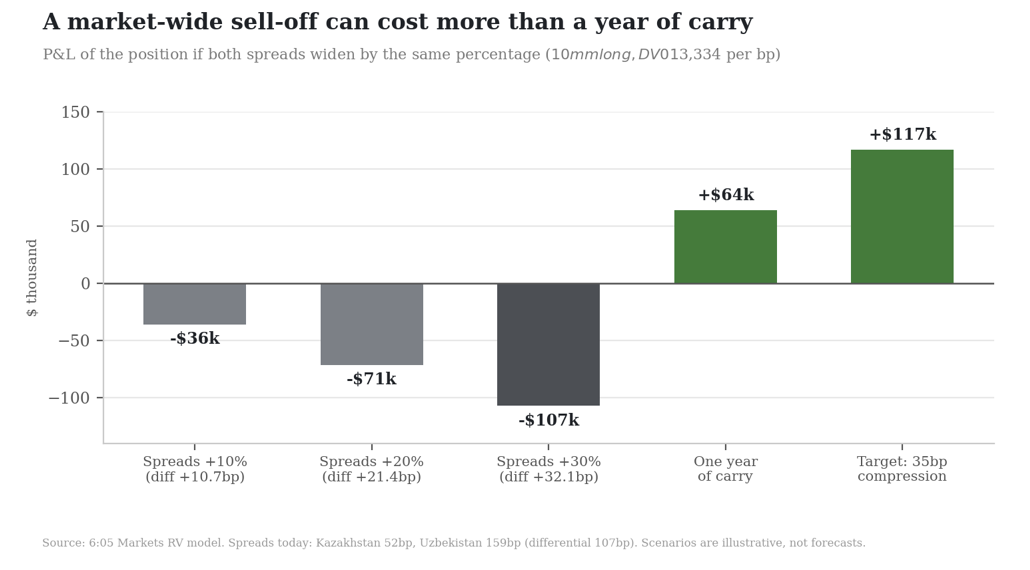
Uzbekistan trades at 159bp over Treasuries and Kazakhstan at 52bp, a differential of 107bp. We would enter at 107bp, target 72bp (35bp of tightening, worth about $117k) and stop at 127bp, over 12 to 24 months. The position earns about $64k a year in carry, so a stop-out costs about $67k before carry and only about $3k after a year of it.
Three points support the trade:
- Uzbekistan’s rating momentum is positive while Kazakhstan’s is largely spent.
- Uzbek growth and debt look stronger than a typical BB credit.
- The target is capped at one notch, because part of the gap reflects the investment-grade cut-off.
A Fitch upgrade alone would add about $99k over twelve months including carry, and upgrades by all three agencies would add ~ $180k. The main risk is a broad sell-off, which would widen Uzbekistan’s spread by more than Kazakhstan’s. If both spreads widen by 20%, the loss will be about $71k, more than a year of earnings. Gold prices, Uzbek supply, and thinner trading in the Uzbek bond are further risks.
The Bonds
On November 24, 2020, USD 555 million sovereign bonds with a maturity date of November 25, 2030, were issued in Uzbekistan. The bonds have a 3.7% coupon rate, and issued at 285bp over US Treasuries.
Just across the border, October 27, 2025 saw the successful issuance of USD 1.5 billion sovereign Eurobonds by the Ministry of Finance of the Republic of Kazakhstan, with the bonds being issued at 85bp over US Treasuries. The bonds in question have a 4.412% coupon rate with an issuance and mature on October 28, 2030. They were issued under Kazakhstan’s USD 15 billion Global Medium Term Note Programme.
Credit Profiles
Kazakhstan
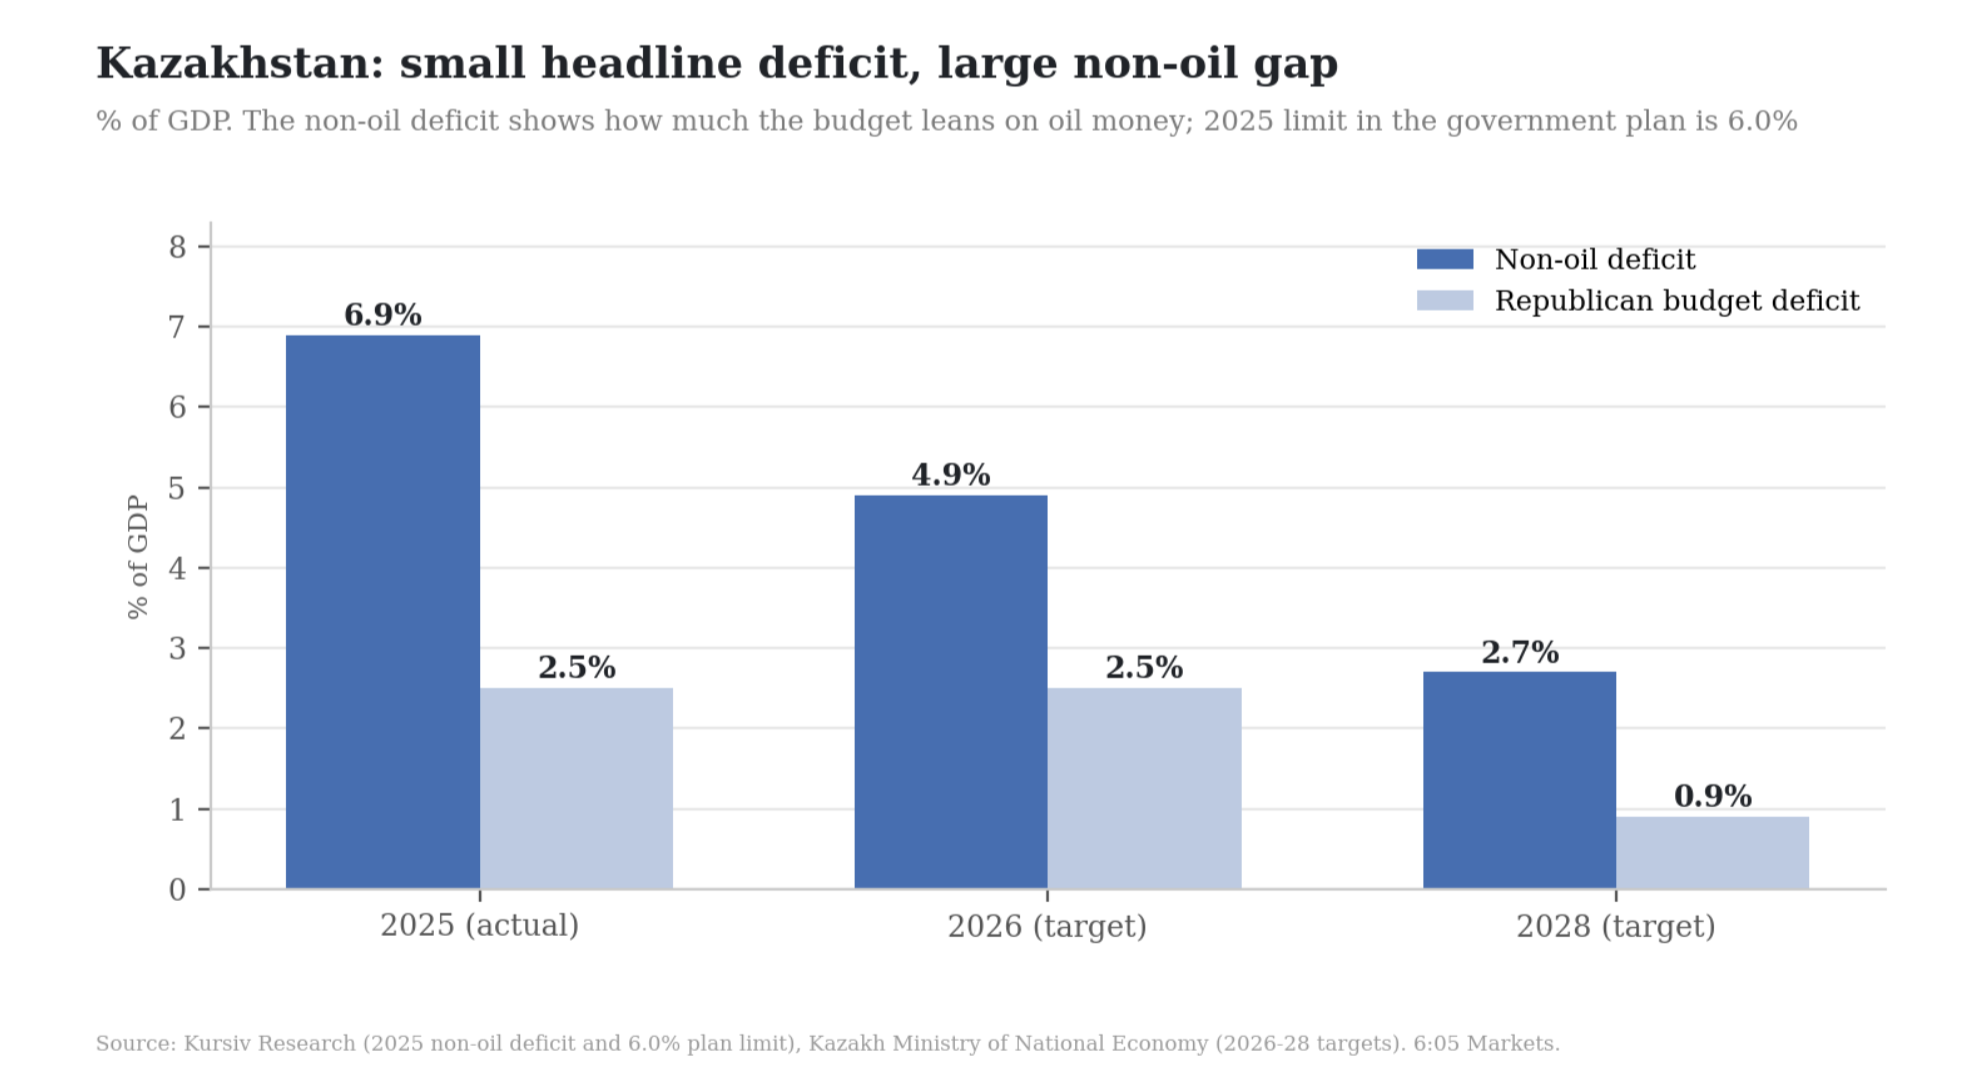
Kazakhstan has a higher-rated but slower-moving credit, with a better balance-sheet strength. Government debt was about 22.8% of GDP in 2025 (Moody’s), the National Fund holds about $65bn, and with reserves, the combined cushion was close to $127bn on July 1, 2026. Growth was steady at 4.2% in the first nine months of 2026 (non-oil sectors grew 5.3% in the first eight months, while mining fell 4.3%). Inflation fell for a twelfth month in a row to 9.3%, which allowed the National Bank to cut its base rate to 15.75%. The weak points are oil and the budget: oil is about 15% of GDP and over 30% of government revenue (S&P). The non-oil deficit was 6.9% of GDP in 2025, which is above the 6.0% ceiling in the government’s fiscal plan. The target is 4.9% in 2026 and 2.7% by 2028, so reinforcement is still just a promise. More than 80% of crude exports run through one pipeline across Russia, since Kazakhstan is landlocked and has no easy alternative, and Moody’s rates Kazakhstan’s institutions below similarly rated peers. At a 52bp G-spread, Kazakhstan’s strengths are already reflected in the bond’s price, so there’s little room for the bond to get more expensive.
Uzbekistan
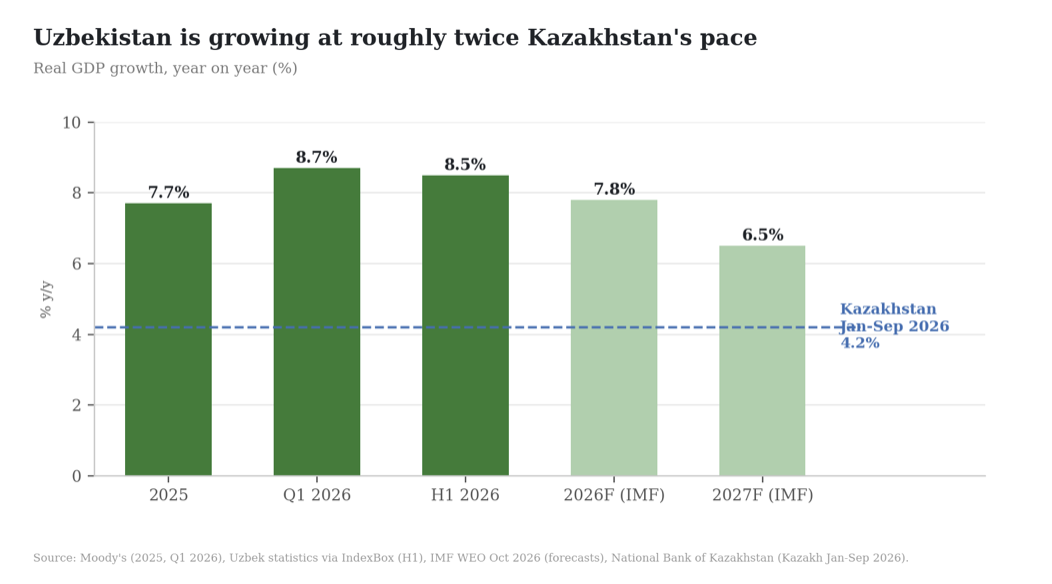
Uzbekistan has the weaker rating but faster growth: 7.7% in 2025 and 8.5% in the first half of 2026, and the IMF forecasts 7.8% for the year. This is almost double Kazakhstan's pace (4.2%). Government debt is about a third of GDP (roughly 30%). Reserves were $66.6bn on October 1st, around 13 months of imports (IMF). Public debt reached $48.3bn in mid-2026, of which 84% is external (over half of the external part is owed to institutions such as World Bank).
Three factors hold Uzbekistan’s rating at BB:
- The current-account deficit is widening to 5.1% of GDP in 2026 from 3.9% (IMF).
- Gold is about 90% of reserves, so they fell $5.5bn in September with the gold price.
- Moody’s puts obligations of state companies and projects at about 25% of GDP, and state banks continue dominating lending.
Inflation of 6.2% to 6.4% sits above the 5% target, with the policy rate at 14%.
These weaknesses explain why the 2030s pay 159bp over Treasuries, but growth and debt look stronger than the BB median, which causes the spread to tighten as ratings catch up.
Ratings Trajectory
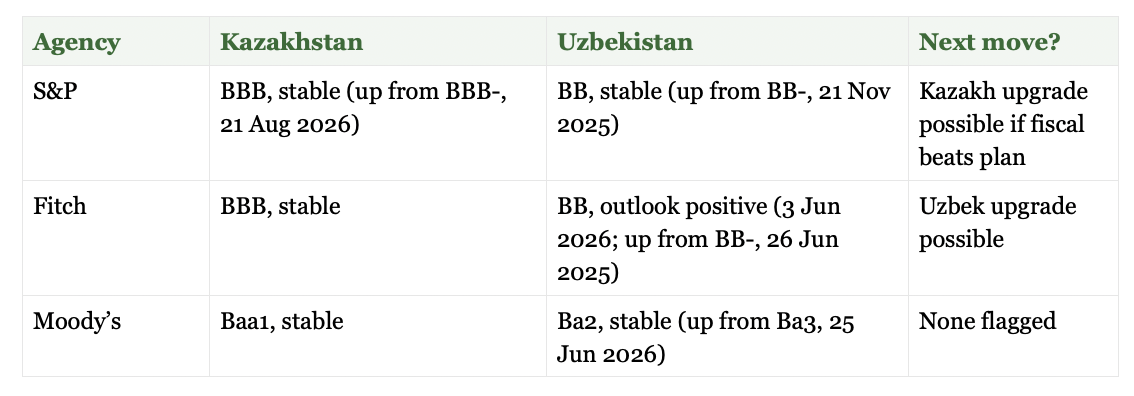
Kazakhstan is investment grade at all three agencies, with stable outlooks, while Uzbekistan is BB at S&P and Fitch and Ba2 at Moody’s.
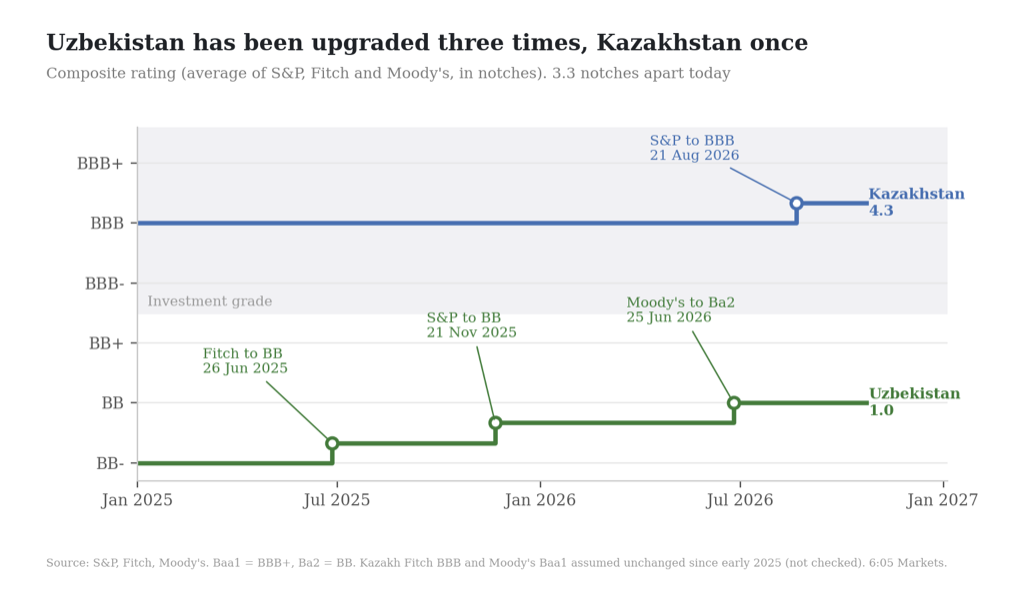
To compare the two countries, convert each rating to notches (BB- = 0, BB = 1, BB+ = 2, BBB- = 3, BBB = 4, BBB+ = 5) and average the three agencies: Kazakhstan comes to 4.3 (between BBB and BBB+) and Uzbekistan to 1.0 (BB); the gap is 3.3 notches.
In early 2025, the gap was 4.0; Kazakhstan has since gained a third of a notch and Uzbekistan gained a notch, so the gap narrowed by about two-thirds of a notch. Fitch is the only agency with a positive outlook on Uzbekistan, but one agency moving one notch makes a shift of only 0.33, worth about 11bp at 32bp per notch. The one-notch 35bp compression targeted by this trade needs all three agencies to upgrade (Fitch and S&P to BB+, and Moody’s to Ba1).
Relative Value Analysis
Spread History
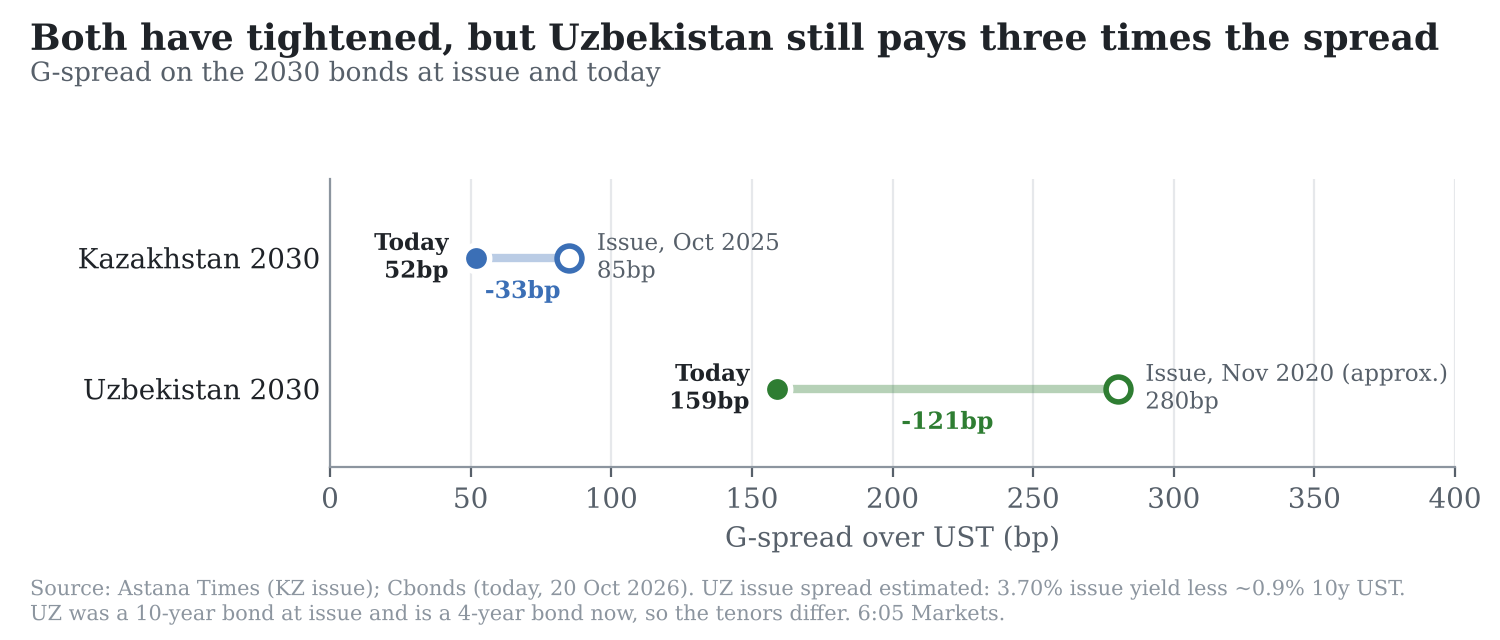
The trade will be measured with a G-Spread differential because the bonds mature four weeks apart, in October and November 2030. This leaves almost no curve risk, so the G-spread differential isolated the credit view. As of October 23, 2030, the Kazakhstan 2030 4.412% bonds trade at a 52bp spread to treasuries, whilst the Uzbek 3.7% 2030s trade at a 159bp spread. This is a 107bp differential, which we believe will tighten. On Z spreads the gap is wider, a 115bp differential. The additional 8 basis points reflects the swap-treasury basis rather than credit, leading us to anchor on G spreads.
The two spreads have travelled very different paths. Kazakhstan priced its 2030s at 4.412%, 85bp over treasuries. That was the lowest yield in the history of the nation, and inside higher rated Poland, Qatar and Saudi Arabia. Since then, the bond has tightened a further 33bp to a 52bp spread to treasuries. This was predominantly due to S&P’s rating upgrade to BBB in August 2026. Thus, Kazakhstan has already been re-rated twice, once by the market at issue, and once by the agency. With stable outlooks at all three agencies, there is no further rating catalyst to drive tighter spreads.
Uzbekistan, on the other hand, priced its 2030s in November 2020 at a 3.7% yield, when the 10-year Treasury yielded below 1%. That was a spread of roughly 280bp. The comparison isn’t exact on tenor, since the bond was a 10-year then and is a 4-year now, but the direction is plain.
As of mid 2025, Uzbekistan has had 5 positive rating actions:
- Fitch upgraded the Sovereign to BB from BB- in June 2025
- Moody’s moved its outlook to positive in June 2025
- S&P upgraded it to BB in November 2025
- Moody’s upgraded it from Ba3 to Ba2 in June 2026
- Fitch moved its outlook to positive in June 2026
The Ministry of Economy and Finance estimates these actions have cut the sovereign’s average cost of new borrowing by 1.5 percentage points. The 159bp spread on the 2030s is the market’s price after all of this. The question is whether it fully prices the next step.
The pattern is a market that has rewarded Kazakhstan’s upgrades promptly, while still demanding a premium for Uzbekistan’s improvement. We take the differential being near the top of its post-issue range as the entry signal.
Fair Value Assessment
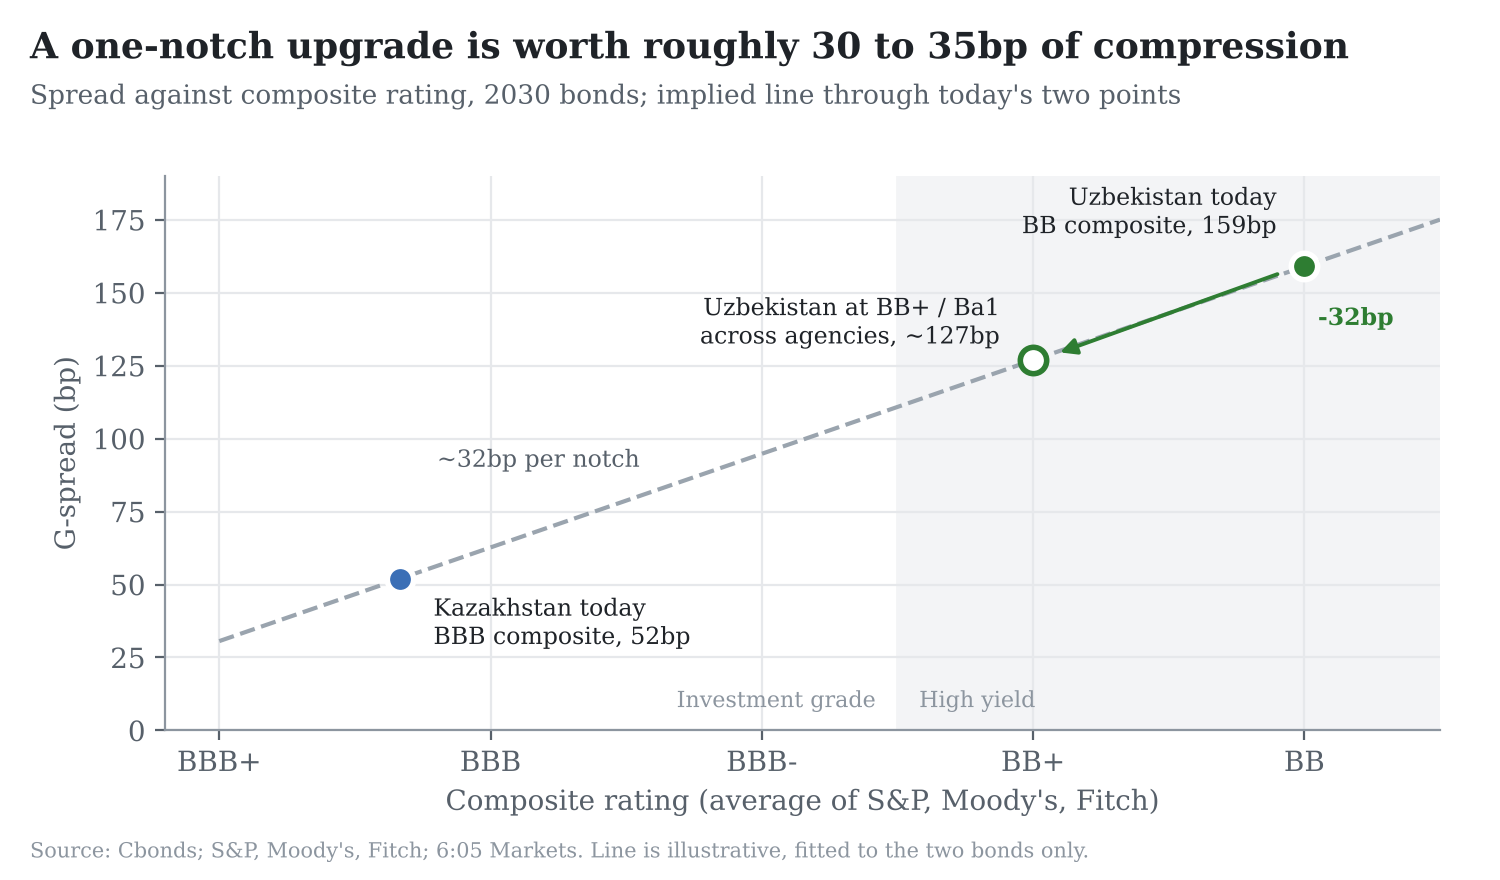
On a purely composite basis, Kazakhstan today sits at BBB/Baa1 (S&P, Fitch/Moody’s) whereas Uzbekistan is at BB/Ba2. That is a gap of 3.3 notches. Dividing the 107bp differential by that gap gives about 32bp per notch, which is roughly in line with the spread-per-notch relationship across BBB and BB emerging market sovereigns. On current ratings alone, the differential is close to fair. The trade therefore is not a claim that Uzbekistan is mispriced today; it’s a claim that the market is pricing today’s ratings rather than tomorrow’s.
There are 3 lines of reasoning that support compression from here:
1. Rating momentum is asymmetric. Fitch’s positive outlook signals a likely upgrade to BB+ within 12 to 24 months. That would cut the composite gap to about 2.3 notches. At the same 32bp per notch, fair value for the differential falls to roughly 75bp, about 30 to 35bp of compression. Kazakhstan, by contrast, carries stable outlooks everywhere and has just been upgraded. Its next move is more likely sideways than up. A trade that is long positive momentum and short exhausted momentum earns the rating catalyst without paying for it in advance.
2. Fundamentals look better than the rating. Uzbekistan’s government debt is about 32% of GDP, against a BB median of around 54%. Growth was 7.7% in 2025 and 8.7% in the first quarter of 2026, and Moody’s expects one of the stronger growth paths among the sovereigns it rates. On these metrics Uzbekistan already screens like a stronger BB credit. Kazakhstan’s tightness is partly justified, since its National Fund holds about 18% of GDP in foreign assets and gross debt is near 25% of GDP. But the bond already prices that strength, trading inside A-rated issuers.
3. Part of the 107bp is structural, which keeps the target honest. Spread per notch isn’t linear. It steps up sharply at the BBB-/BB+ boundary, because investment-grade mandates cannot hold high-yield paper. Some of today’s differential is this crossover premium, and it won’t compress until Uzbekistan approaches investment grade, which is a multi-year prospect. We therefore set a target of 35bp of compression, one notch’s worth, rather than a full convergence that the index structure would not support.
Carry and Roll-Down
The trade is DV01-neutral. On a $10mm long in the Uzbek 2030s, with a DV01 of $3,334/bp, we short $9.55mm of the Kazakh 2030s. That’s a hedge ratio of 0.955x, slightly below one because the Uzbek bond’s lower dirty price (91.65 against 98.58) offsets its marginally longer duration. Positioned this way, an equal move in both spreads, or in Treasuries, leaves the Profit & Loss unchanged. Only the differential matters.
| Component | $ Value |
|---|---|
| Yield income, Uzbek Long (6.48% YTM) | +593,947 |
| Yield Cost, Kazakh Short(5.41% YTM) | -509,005 |
| Borrow Fee at 35bp | -32,944 |
| Net Cash Reinvested | +11,778 |
| Total Carry | +63,776 |
Roll-Down in this trade acts primarily as a secondary contributor. Over six months each bond rolls from about 4.0 to 3.5 years. On the current Treasury curve, that’s worth about 2bp on each leg, which cancels under DV01 neutrality. The spread roll, on the other hand, does remain. Uzbekistan’s dollar curve slopes upward across its 2028 to 2033 maturities, so the long leg earns modest positive roll as it shortens. Kazakhstan’s curve is flat and tight, so the short leg gives up little. As for the pull to par, the Uzbek bond trades at about 90 and the Kazakh bond at about 96. Pulling to par is already in each yield, but the Uzbek long’s deeper discount means more of its return comes from price accretion, which is less exposed to reinvestment risk than coupon income.
Trade Construction
Structure and Sizing
| Long | Short | |
|---|---|---|
| Bond | Uzbekistan 3.7% Nov 2030 | Kazakh 4.412% 2030 |
| ISIN | XS2263765856 | XS3212533262 |
| Face | $10mm | $9.55mm |
| Dirty Price | 91.65 | 98.58 |
| Market Value | $9.165mm | $9.414mm |
| Yield to Maturity | 6.48% | 5.41% |
| DV01 | $3,334 / bp | $3,334 / bp |
| Implied modified duration | 3.64 | 3.54 |
As depicted in the above table, the structure of our trade is that of a small net cash inflow due to the market value of the short exceeding that of the long by roughly $249k. The associated spread differential is 107bp (given by 6.48% - 5.41% from both the table above and the table in Carry and Roll-Down), and every 1bp is worth $3,334.
One aspect of the trade worth noting is the 107bp, specifically its consistency across the yield and G-Spread differences. This consistency is caused by the use of the same Treasuries as benchmarks for both differences.
Hedging
Our trade is structured in a manner that, with net DV01 being close to zero, causes the value of each leg to change by an amount that is roughly alike in opposite directions in the case of a parallel move in Treasury yields. This is of importance in the current market. Since their initial issue, the Kazakh bonds in question have tightened 33 bp against Treasuries, but they trade at a clean price of roughly 96 against an issue price that is near par. This is caused by the 5-year Treasury yield rising from 3.6% at issue to 4.9% now, which largely offsets the tighter spread and leaves the bond yield approximately 100bp higher. If a long Uzbek position was unhedged and held, this move would have cost it value. However, the presence of a Kazakh short largely offsets a similar rise in yields.
There are a few risks worth talking about. The first risk is borrowing. We assume 35bp of compression, and each 10bp increase costs about $9.4k a year. In the hypothetical case of the borrowing fee doubling to 70bp, carry would drop from about $64k to $31k, with the carry cushion subsequently shrinking from 19bp to 9bp. On a similar note, the lender could also recall the bond. In the case of an inability to re-borrow it elsewhere, one would be forced to buy it back, leaving the Uzbek long without its rate hedge.
Our second risk is drift. DV01 ratios move over time and as prices pass, so we would re-hedge when the mismatch exceeds 5% of the $3,334 DV01. Because the bonds mature four weeks apart, curve mismatch is minimal.
Entry, Target and Stop
Spread Sensitivity Before Carry
| Change in differential | P&L |
|---|---|
| Tightens 50bp | +$166,700 |
| Tightens 20bp | +$66,680 |
| Tightens 10bp | +$33,340 |
| Widens 10bp | -$33,340 |
| Widens 20bp | -$66,680 |
| Widens 50bp | -$166,700 |
We are entering at a G-spread differential of 107bp, and we are targeting 72bp with a stop at 127bp over a 12-24 month period. On today’s ratings, the spread is roughly fair at about 32bp per notch.
The stop at 127bp is a 20bp widening and a loss of about $66.7k, or 0.67% of the long notional, which gives 35bp of upside against 20bp of downside (1.75x) before carry. Carry of about $64k a year (19bp) cushions the stop only over time. We would exit early if Fitch reversed its positive outlook, or if Kazakhstan’s outlook turned positive and removed the case for the short.
Key Risks
The trade is built so that moves in US interest rates cancel out; it does not cancel the risks below and each of them hits the two legs differently.
Commodity Exposure
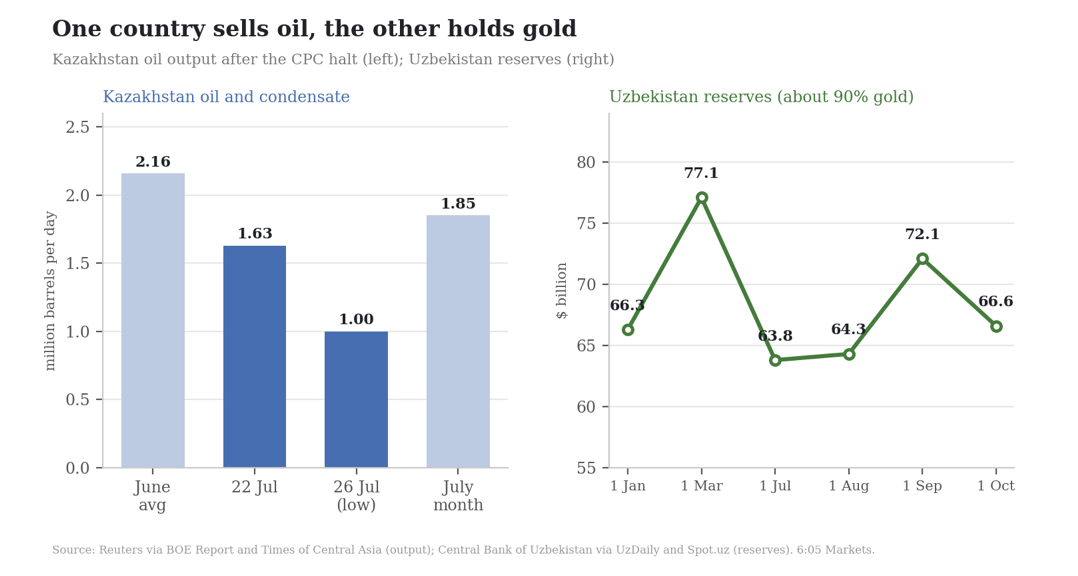
Kazakhstan depends on oil: 46.5% of Kazakhstan’s goods exports in the first half of 2026 were oil and oil products. More than 80% of crude leaves through the CPC (Caspian Pipeline Consortium) pipeline to Russia’s Black Sea coast, and in late July drone strikes on tankers stopped oil shipments for about a week. Output fell from roughly 2.16 million barrels a day in June to ~1 million at the low point, and the government has cut its 2026 plan to 96 million tonnes. Barrels that cannot be shipped earn no tax.
Uzbekistan also depends on a single commodity: gold. It was 41% of goods exports in 2025 (Fitch), and it’s about 90% of reserves. Gold fell roughly 9% in September, and reserves dropped $5.5bn in a month to $66.6bn (13.6% below the March peak). An oil disruption helps our short, and a gold price drop hurts our long, but since these are separate, one won’t cover the other. Kazakhstan has the National Fund as a cushion, while Uzbekistan’s cushion is gold, which is the commodity that falls.
Supply and Liquidity
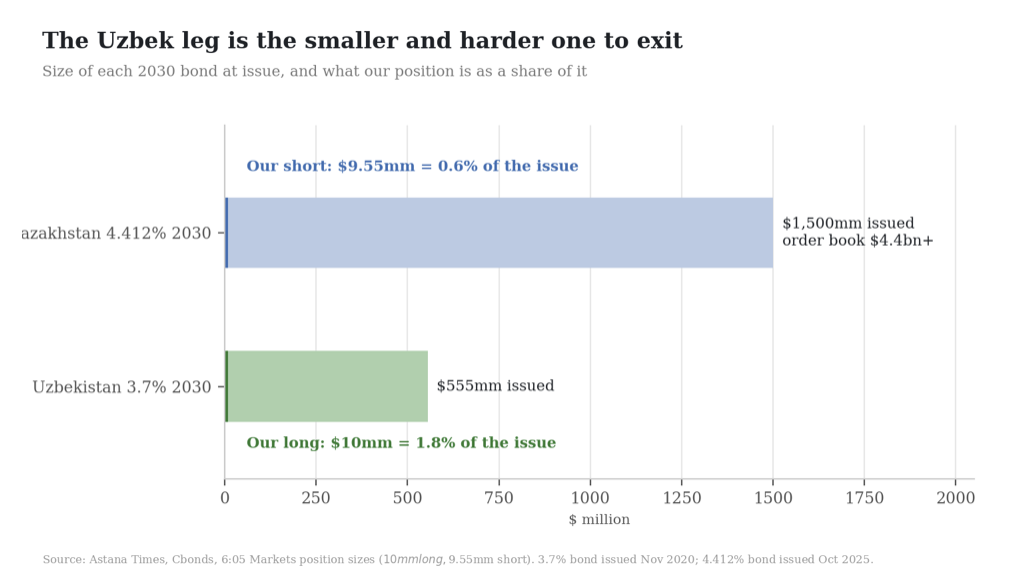
The Kazakh 2030s are $1.5bn, with an order book above $4.4bn. The Uzbek 2030s are $555mm. Our $10mm long is 1.8% of the Uzbek issue and our $9.55mm short is 0.6% of the Kazakh one, so the Uzbek leg is harder to exit in a sell-off, as well as the first to see wider dealer quotes. Its 3.7% coupon is well below market yields, so it trades far under par. Uzbek companies are also borrowing in dollars: National Bank of Uzbekistan and Navoiyuran have each issued $300mm of bonds due 2030, and fintech firm Uzum is weighing a debut Eurobond. These bonds compete with the government’s bonds for the same emerging-market investors, which could push its price down.
Global Risk Sentiment
Our trade is hedged against US Treasury yields, but it is not hedged against investor fear. If they rise or fall, both bonds move together and the effects cancel. The US 5-year yield was 4.94% on October 19th, up from about 3.56% when Kazakhstan sold its bond. The Fed raised rates in September, and oil is above $100. Since Uzbekistan’s bond has higher risk, investors demand extra yield, so Uzbekistan’s spread is 159bp, which is three times Kazakhstan’s (52bp).
Example: if both spreads widen by 20%, Uzbekistan’s will rise about 32bp and Kazakhstan’s about 10bp, so the gap will widen by about 21bp. At $3,334 per bp, we would lose about 71k, which is more than a year of earnings (64k). The cushions (reserves, low debt) make an Uzbek-only problem less likely, but they won’t stop a global sell off.
Our Position on the Matter
We believe the relative value case for long Uzbekistan 2030s against short Kazakhstan 2030s is compelling, and we recommend the trade on a DV01-neutral basis. We would enter at a differential of 107bp, targeting 72bp with a stop at 127bp, over a 12 to 24 month horizon. On a $10mm Uzbek long, that means a $9.55mm Kazakh short, with each basis point of compression worth $3,334.
On today’s ratings alone, the spread is broadly fair. The opportunity lies in where each credit is heading. Kazakhstan has already been re-rated twice, once by the market when it priced the 2030s inside Poland and Qatar, and again by S&P in August. With stable outlooks across all three agencies, there is little left to drive its spreads tighter. Uzbekistan is still mid-way through its re-rating. Six positive actions in fifteen months have taken it from BB- to BB, and Fitch’s positive outlook points towards BB+. With debt at roughly 32% of GDP against a BB median of 54%, and growth of 7.7% last year, the agencies appear to be following the data rather than leading it.
What makes this a trade rather than merely a view is the carry. The position earns around $64k a year, so it makes money in every scenario short of a broad sell-off. A full upgrade across the agencies would return roughly $180k over twelve months, a Fitch upgrade alone around $99k, and unchanged spreads around $64k. Even a 20bp widening to our stop costs only about $3k once carry is included. We are, in effect, paid to wait for a catalyst the agencies have already flagged.
Concluding Statement
The long Uzbekistan, short Kazakhstan 2030s trade is a wager on two sovereigns at different points in their credit stories. Kazakhstan's bonds now price its fiscal strength in full, leaving a stable credit with limited room to tighten and meaningful exposure to oil. Uzbekistan's spreads, meanwhile, still embed a premium that should narrow as the agencies follow through on their positive outlooks. The trade carries real risks, most notably an oil rally, heavier Uzbek issuance and a broad emerging market sell-off. Even so, it is paid to wait and protected by a disciplined stop, and its upside rests on a catalyst the agencies have already signaled. Taken together, it offers limited downside, steady carry, and a credible path to 30 to 35bp of compression as Uzbekistan's ratings catch up with its fundamentals.
The G-spread differential between Uzbekistan's 3.7% 2030 bond and Kazakhstan's 4.412% 2030 bond will be at or below 72bp on 20 October 2028.
Series Uzbekistan 2030 less Kazakhstan 2030 G-spread (bp) Entry 107.00 Target at or below 72.00 By 20 Oct 2028 Written 20 Oct 2026
Resolves against the readings entered for XS2263765856 less XS3212533262 G-spread on the last observation on or before 20 Oct 2028. Not investment advice.
Data Sources
- Kinstellar: Kazakhstan’s $1.5bn 4.412% 2030 sovereign Eurobond
- Cbonds: Uzbekistan 3.7% 25 Nov 2030 USD bond details
- Times of Central Asia: Kazakhstan’s strong bond sale anchors regional capital markets
- Dunyo: Uzbekistan raises $1bn through landmark local-currency bond
- Kun.uz: Uzbekistan to issue $1.5bn in sovereign Eurobonds
- Zawya/IFR: Uzbekistan eyes debut international sukuk
- Astana Times: Kazakhstan draws strong demand for $1.5bn Eurobond at record-low yield
- National Bank of Kazakhstan: S&P upgrades Kazakhstan to BBB
- ICE: S&P upgrade rationale and fiscal forecasts
- National Bank of Kazakhstan: Fitch affirms BBB, stable
- Trend: Moody’s affirms Kazakhstan’s Baa1, stable
- Fergana: Fitch revises Uzbekistan outlook to positive
- Gov.uz: Moody’s upgrades Uzbekistan from Ba3 to Ba2
- Daryo: Moody’s lifts Uzbekistan to Ba2 on growth and fiscal progress
- Kun.uz (Russian): S&P raises Uzbekistan to BB
- FXEmpire: Uzbekistan rating action history
- IMF: Kazakhstan Article IV press release
- IMF: Kazakhstan Article IV staff report (PDF)
- IMF: Uzbekistan 2026 Article IV press release
- IMF: Uzbekistan Article IV staff report (PDF)
- World Bank: Kazakhstan Economic Update 2026
- Kun.uz: World Bank upgrades Uzbekistan’s 2026–27 growth forecasts
- National Bank of Kazakhstan: Q2 2026 macro and market overview
- Orda: National Fund assets reach $64.6bn as Kazakhstan cuts withdrawals
- Daryo: Uzbekistan’s public debt reaches $48.3bn
- Daryo: Uzbekistan’s total external debt rises 16.5% to $84.1bn
- Times of Central Asia: Kazakhstan restructures oil exports amid CPC disruptions
- Vlast.kz: Kazakhstan’s oil production and exports shrink by 20% in Q1
- Daryo: Uzbekistan’s foreign reserves rise to $72.1bn as gold holdings increase
- Kun.uz: Uzbekistan records no gold exports in August