Crude Is Returning. Diesel Isn't: The Distillate Bottleneck in Global Oil Markets
The global oil market is undergoing a shift in where its supply constraints are concentrated. Middle Eastern crude exports have largely recovered towards pre-conflict levels, but refined-product supply remains severely impaired. The disruption has increasingly become a question of refining capacity, rather than crude availability alone. Our central view is that diesel supply will normalise more slowly than crude exports, keeping middle-distillate margins elevated while refining and delivery constraints persist.

Executive Summary
September crude and condensate exports excluding Iran reached 99.4% of the pre-conflict level, while regional fuel exports remained below half. Reuters reports more than 2.3 mbpd of refining capacity offline. The consequences are visible internationally. The IEA estimated an August Gulf/Russia net diesel-export shortfall of 1.6 mbpd versus February. US distillate stocks stood at 105.1 million barrels on 2 October, about 12% below their seasonal five-year average. These figures describe different periods and parts of the supply chain, but together support a slower product recovery.
Our base interpretation is uneven relief: more crude and better shipping let functioning refiners lift output before the full repair programme is complete, while emergency diesel releases cushion the shortage. That keeps margins high without implying that diesel prices must rise further. The main risks to this view are faster delivery of reserve stocks, more refinery output available for export, and weaker diesel demand. We would reduce conviction if three things happen together: delivered diesel volumes rise, East Coast stocks move back toward their seasonal average, and the NYH diesel-minus-Brent spread narrows.
Key Numbers
| Middle-East crude export recovery | Middle-East fuel export recovery | Regional refining capacity offline | US distillate stocks vs 5 year average |
|---|---|---|---|
| 99% | <50% | 2.3 mbpd | -12% |
Sources: Reuters/Kpler, 12 October 2026; EIA Weekly Petroleum Status Report, 7 October 2026. Crude export recovery excludes Iran; refinery capacity represents outages, not necessarily lost output.
Diesel Pricing and Refining Margins
Diesel prices have risen faster than crude, indicating that refining capacity and product availability are increasingly important constraints. The price evidence supports the distinction between crude supply and product availability. In September New York Harbor wholesale ULSD averaged $4.956 per US gallon, while Brent averaged $114.16 per barrel. On the same volume basis, the diesel-minus-Brent indicator was $93.99/bbl, versus $34.15/bbl in February. These are monthly spot-price comparisons, not current executable quotes.
Figure 1 · Diesel and Brent prices
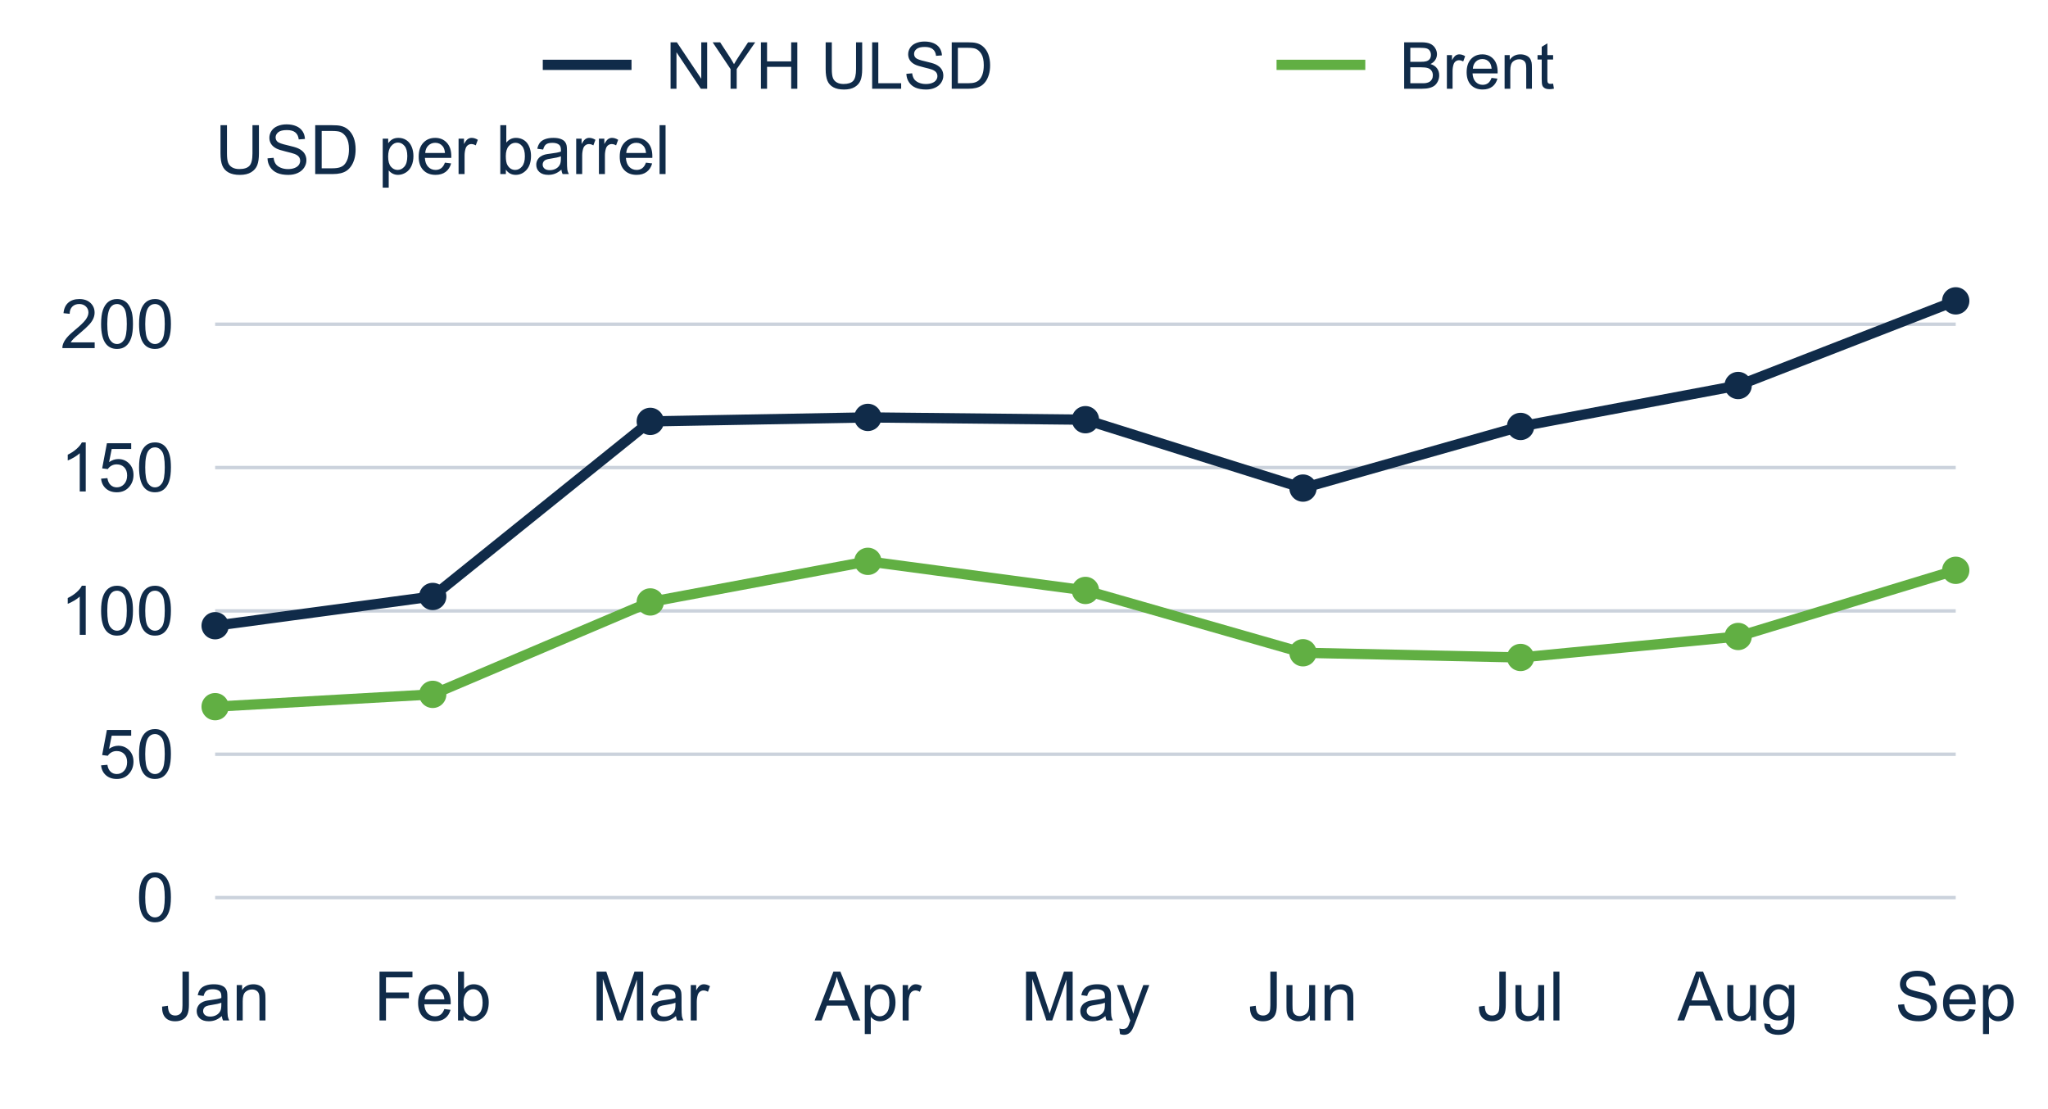
Figure 2 · Diesel value less Brent
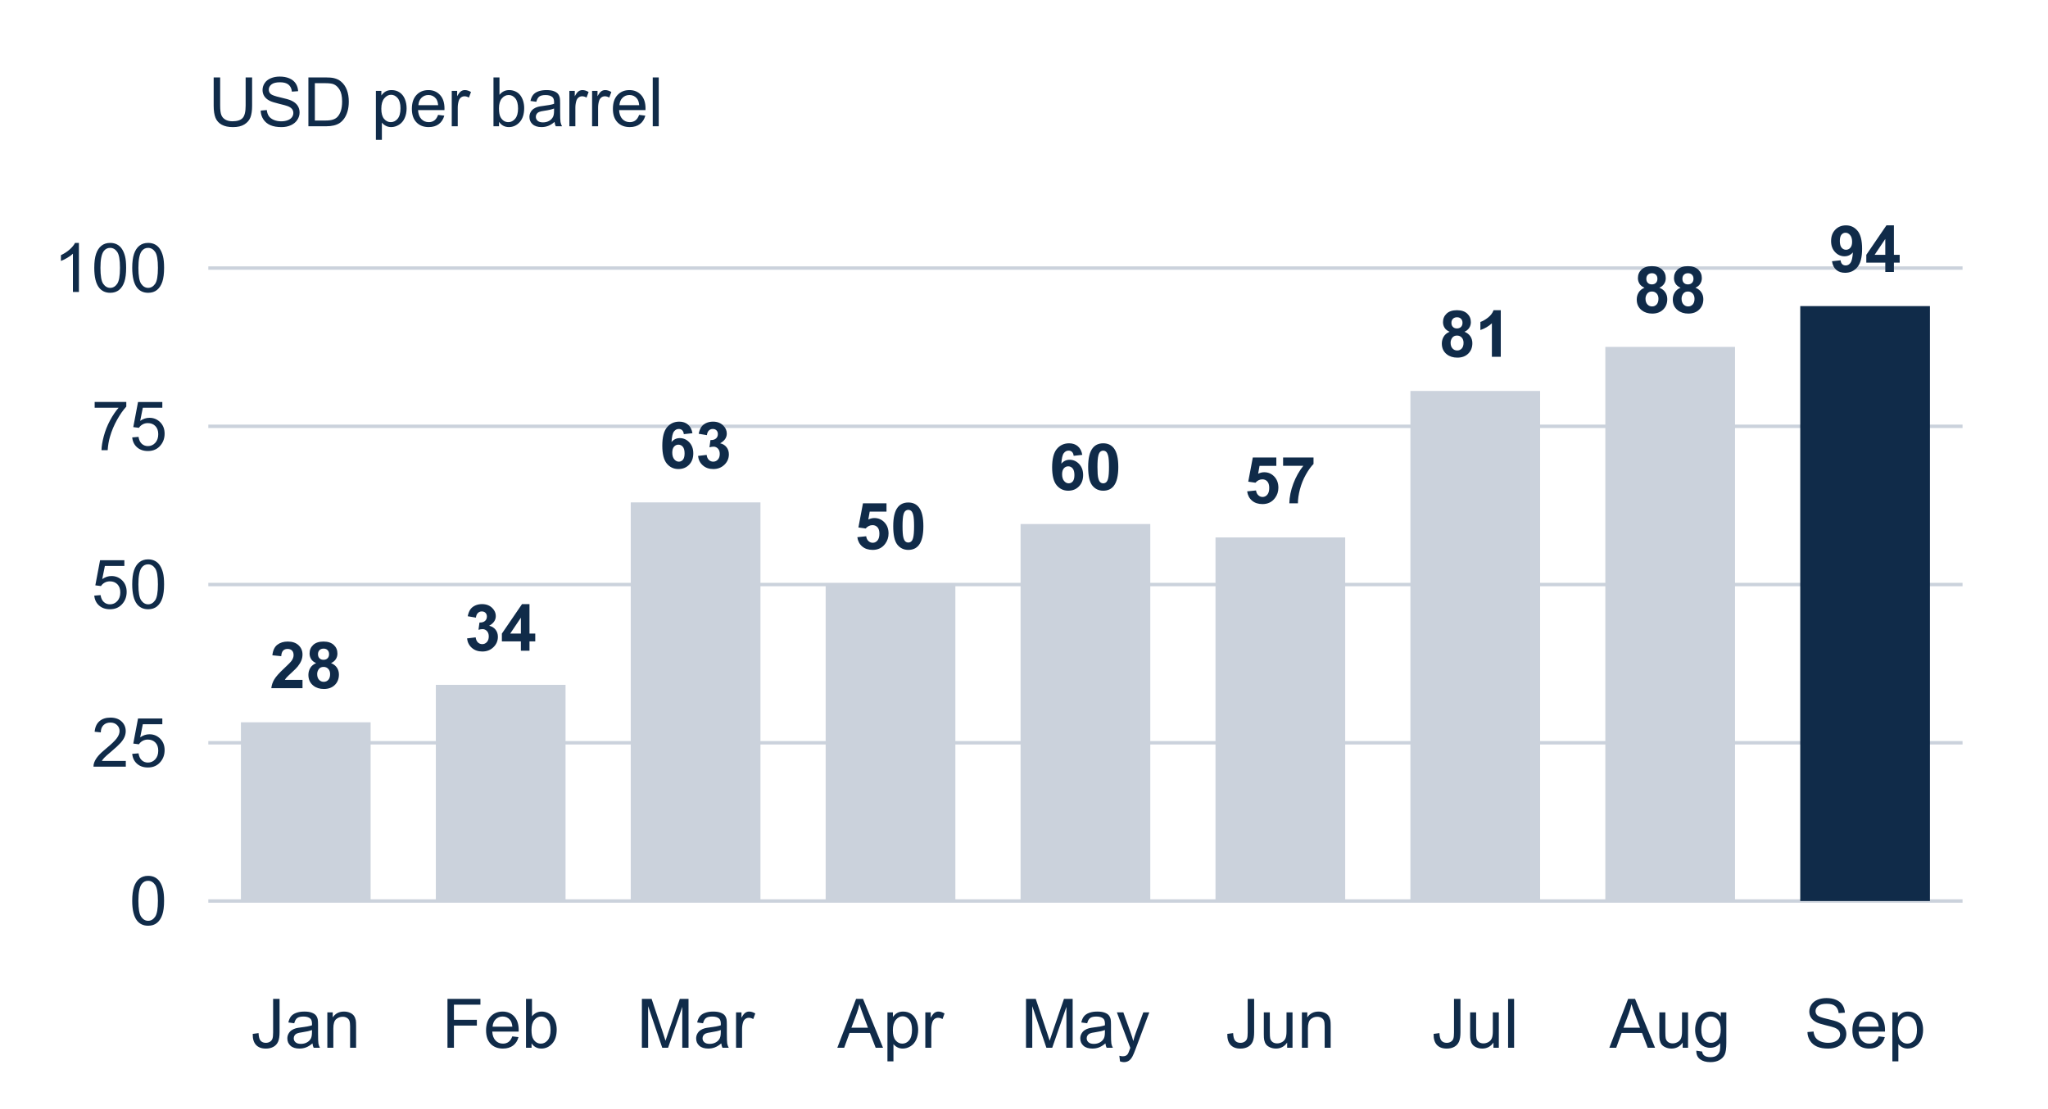
Sources: EIA Tables 11–12; barrel conversion; 6:05 calculations.
A Crack Spread Is a Margin Indicator Rather Than Net Profit
The diesel crack measures product value relative to crude on a common volume basis. EIA uses New York Harbor diesel and Brent to illustrate this relationship. The benchmark is useful for tracking scarcity, but an individual refinery buys a particular crude slate and sells a basket of products. Its realised economics also depend on freight, energy, maintenance, yields and operating reliability. [5]
| Exposure | Potential effect of persistent tightness | Condition that changes the result |
|---|---|---|
| Functioning export refiners | Stronger product value relative to feedstock | Usable capacity, delivered crude and access to export markets. |
| Crude producers | Returning exports improve available sales volume | Crude pricing can ease even while diesel remains scarce. |
| Freight and fuel users | Higher delivered fuel costs compress margins | Fuel surcharges, hedges and demand determine pass-through. |
The Scarcity Premium Can Fall Before Diesel Becomes Cheap
Cheaper crude and a narrower diesel premium are different changes. Either can lower the wholesale fuel price, while retail prices also include distribution and taxes. A refiner can see a weaker benchmark margin even with strong absolute diesel prices. For market exposure, the comparison must therefore specify the crude benchmark, delivery month, product grade and geography.
The bottleneck supports the product premium while relief remains incomplete. It does not establish mispricing: a trade still needs current quotes, forward expectations, costs and an attractive entry price.
Why Diesel Has Outperformed Crude
Benjamin Lozovsky
Diesel has primarily outperformed crude due to where the disruption in the market occurred. Between February and September, NYH ULSD roughly doubled from $105/bbl to $208/bbl. On the other hand, Brent rose from $71 to $114.
The path matters just as much as the total. The initial shock in March and April was primarily led by crude, whereas diesel was largely flat. However, the second phase altered the narrative entirely. From June to September Brent rose by $29 whereas ULSD rose by $65. This is because crude logistics began to adapt, but the product supply did not change.
This is primarily due to 3 structural features:
- The Gulf is a distillate exporter, supplying 15% of global diesel exports prior to the war. Its combined diesel and jet fuel exports of 1.7 million barrels per day (mbpd) dwarfed its gasoline exports of 0.45 mbpd. A disruption to the Gulf refineries, thus, falls largely on the middle distillates. Product cargoes are also harder to move than crude. This is why, by August, dark transits had restored Hormuz crude flows to an estimated 40% to 50% of pre-war volumes, while refined product flows had shown no meaningful recovery.
- Russia was removed as the Atlantic Basin’s swing supplier at the same moment. Ukrainian strikes on secondary processing units, followed by a July export ban, cut Russian middle-distillate exports from more than 0.8 mbpd in 2025 to 0.05 mbpd by the end of July. Russia's former customers in Turkey, Brazil, and West Africa have since competed with Europe for US and other replacement cargoes.
- The emergency response was built for crude. From the IEA’s 400 million barrel release, 72% was crude. The relief therefore accrued largely to crude prices, widening rather than narrowing the product premium.
As a result, the marginal supplier has been forced to absorb the gap. US-based refiners reached 97.2% utilisation in mid-August and lifted product exports by 20% y/y.
Quantifying the Replacement Requirement
Benjamin Lozovsky
The IEA's estimate of an August Gulf and Russian net diesel-export shortfall of 1.6 mbpd against February provides the size of the hole. Russia accounts for roughly 0.75 mbpd of this, based on the collapse in its middle-distillate exports, with the Gulf making up the remainder. The question is how much of that volume can realistically be replaced, and from where.
Replacing 1.6 mbpd of diesel through incremental refining alone would require 4.6 to 5.3 mbpd of additional crude throughput, assuming distillate yields of 30% to 35%. That is almost exactly the shortfall that persisted in August, when refinery runs East of Suez remained 5 mbpd below pre-war levels. Returning crude adds feedstock, but the missing variable is the capacity to process it.
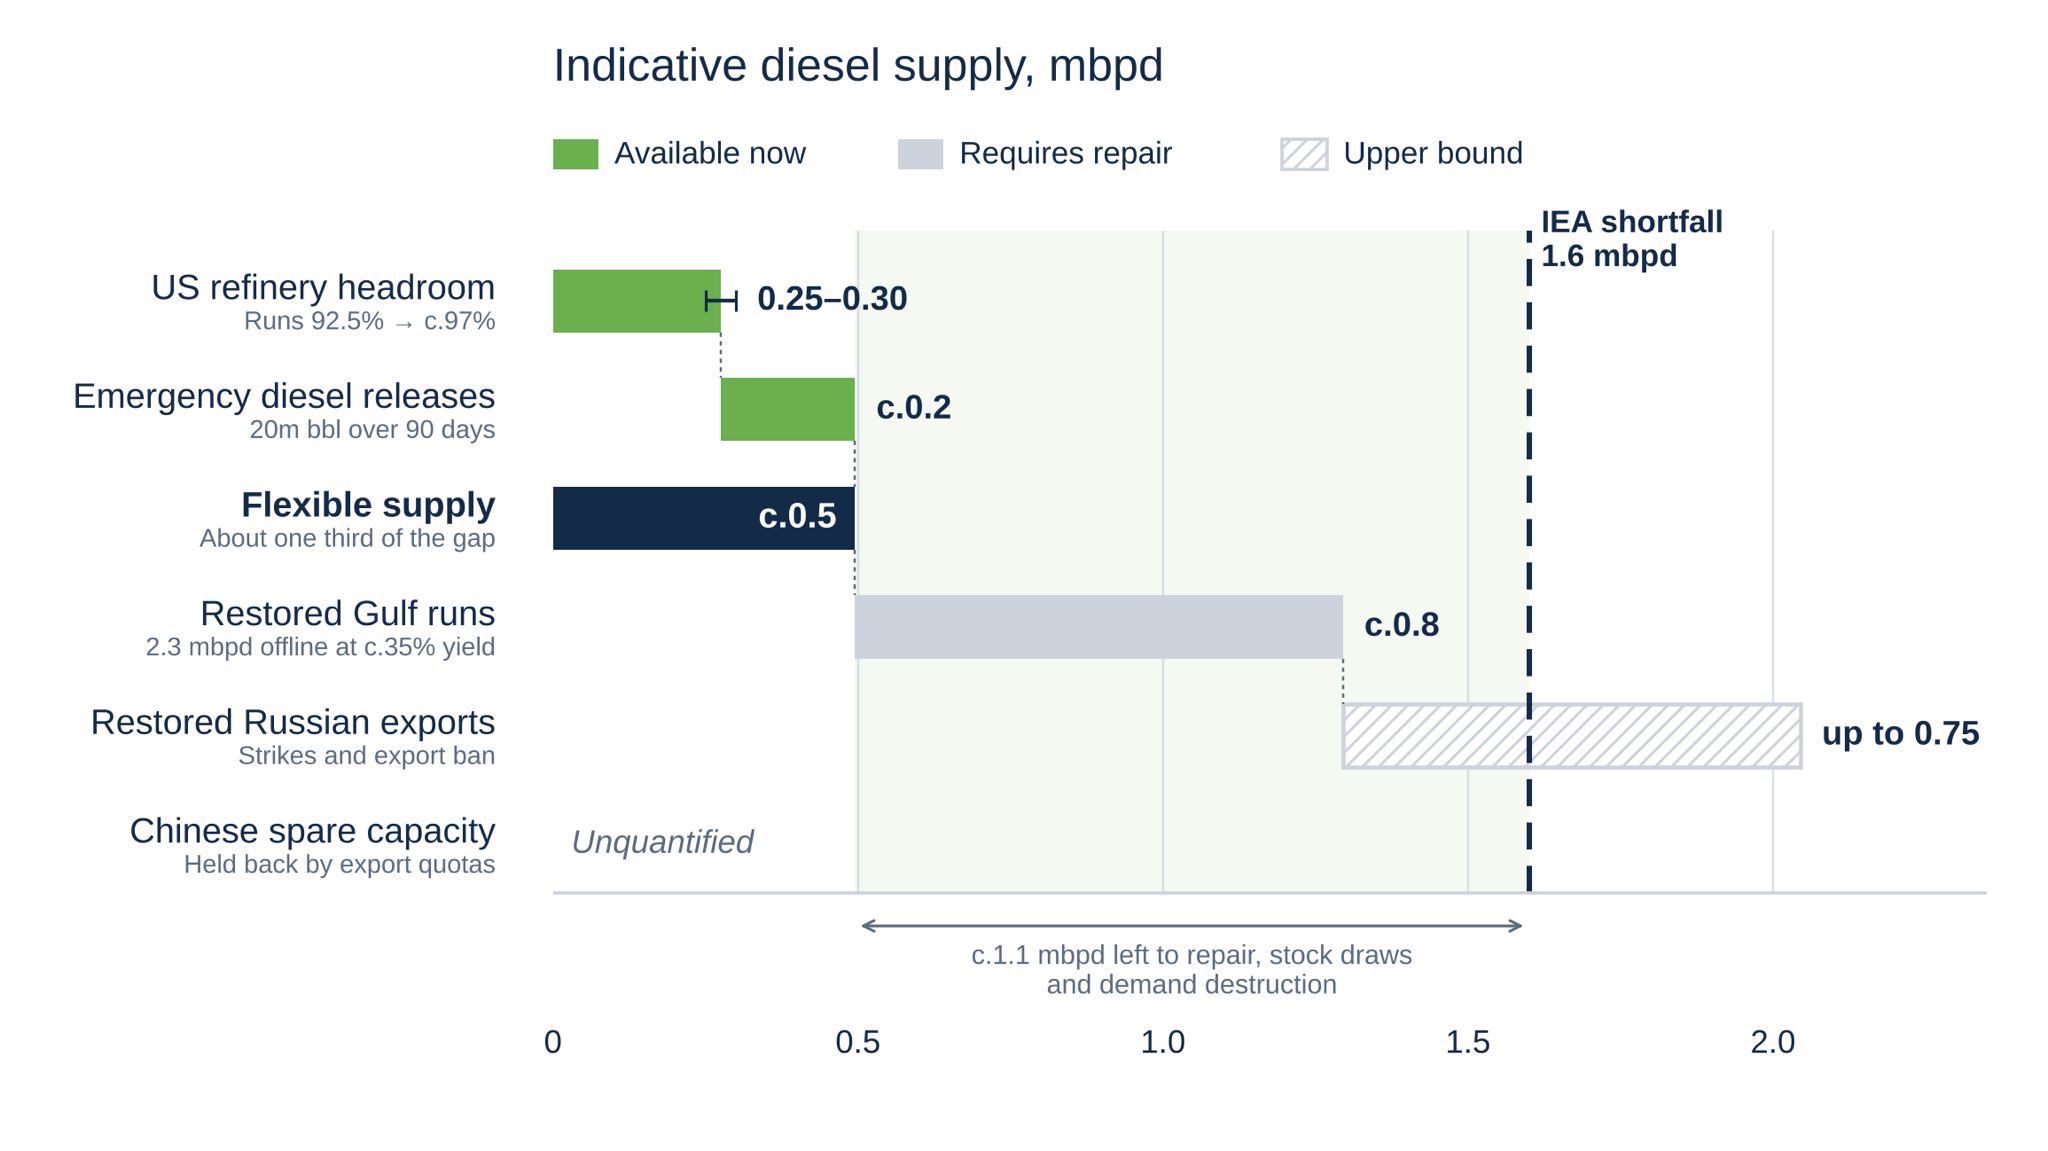
The flexible sources, US headroom and emergency stocks amount to 0.5 mbpd, or about a third of the gap. Even running every US refinery at full nameplate on 18.4 mbpd of operable capacity would yield only about 0.45 mbpd of additional distillate. Viewed differently, the 20 million barrel release covers about twelve days of the global shortfall, or roughly fills the US distillate deficit against its five-year average once. At 12% below average, that deficit is 14 million barrels.
The remaining two-thirds depends on physical repairs in the Gulf and Russia, neither of which responds to crude availability. China holds the largest pool of idle capacity, with state refiners at 73% utilisation and independents at 50%.
Measurement note: the replacement arithmetic is a sensitivity, not a reconciled October supply forecast. Export losses, refinery throughput and damaged capacity describe overlapping constraints and should not be added together. The emergency-stock delivery schedule is considered separately below.
Policy Relief Versus Structural Repair
Emergency stocks can ease the immediate shortage, but their impact depends on the fuel released, its delivery point and its timing. On 15 October, the IEA reported approximately 330 million barrels delivered under its March action, with around 100 million still to come. Plans include accelerating more than 20 million barrels of diesel. These are remaining commitments within the existing action, rather than an entirely new release.
The G7’s 2 October statement outlined a release over four months, with diesel prioritised during the first twenty days. Its headline volume and the IEA’s remaining commitments should not be treated as two separate pools. Announced barrels also do not establish that fuel has arrived in a deficit market. For diesel prices, the relevant measure is usable product delivered to buyers.
Delivery Speed Changes the Near-Term Relief
A 20 million barrel reference volume would provide 1.00 mbpd over twenty days, but only 0.33 mbpd over sixty. These illustrative schedules compare scale; they are not official delivery plans. The 1.6 mbpd export gap is an August benchmark, rather than an estimate of October’s shortage.
| Illustrative delivery | Average diesel flow | Share of August export gap |
|---|---|---|
| 20 days | 1.00 mbpd | 62.5% |
| 60 days | 0.33 mbpd | 20.8% |
| 120 days | 0.17 mbpd | 10.4% |
Sources: 6:05 calculations. Fixed reference volume, constant illustrative delivery rate; no allowance for transport or grade constraints.
Reserve deliveries can narrow immediate diesel premiums before damaged refineries return. However, the stock is finite and must eventually be replenished. More durable relief requires higher refinery output, sufficient distillate yields and reliable delivery routes. Our view therefore depends on recurring supply replacing emergency support, rather than policy announcements alone. [8, 9]
The US Inventory Constraint
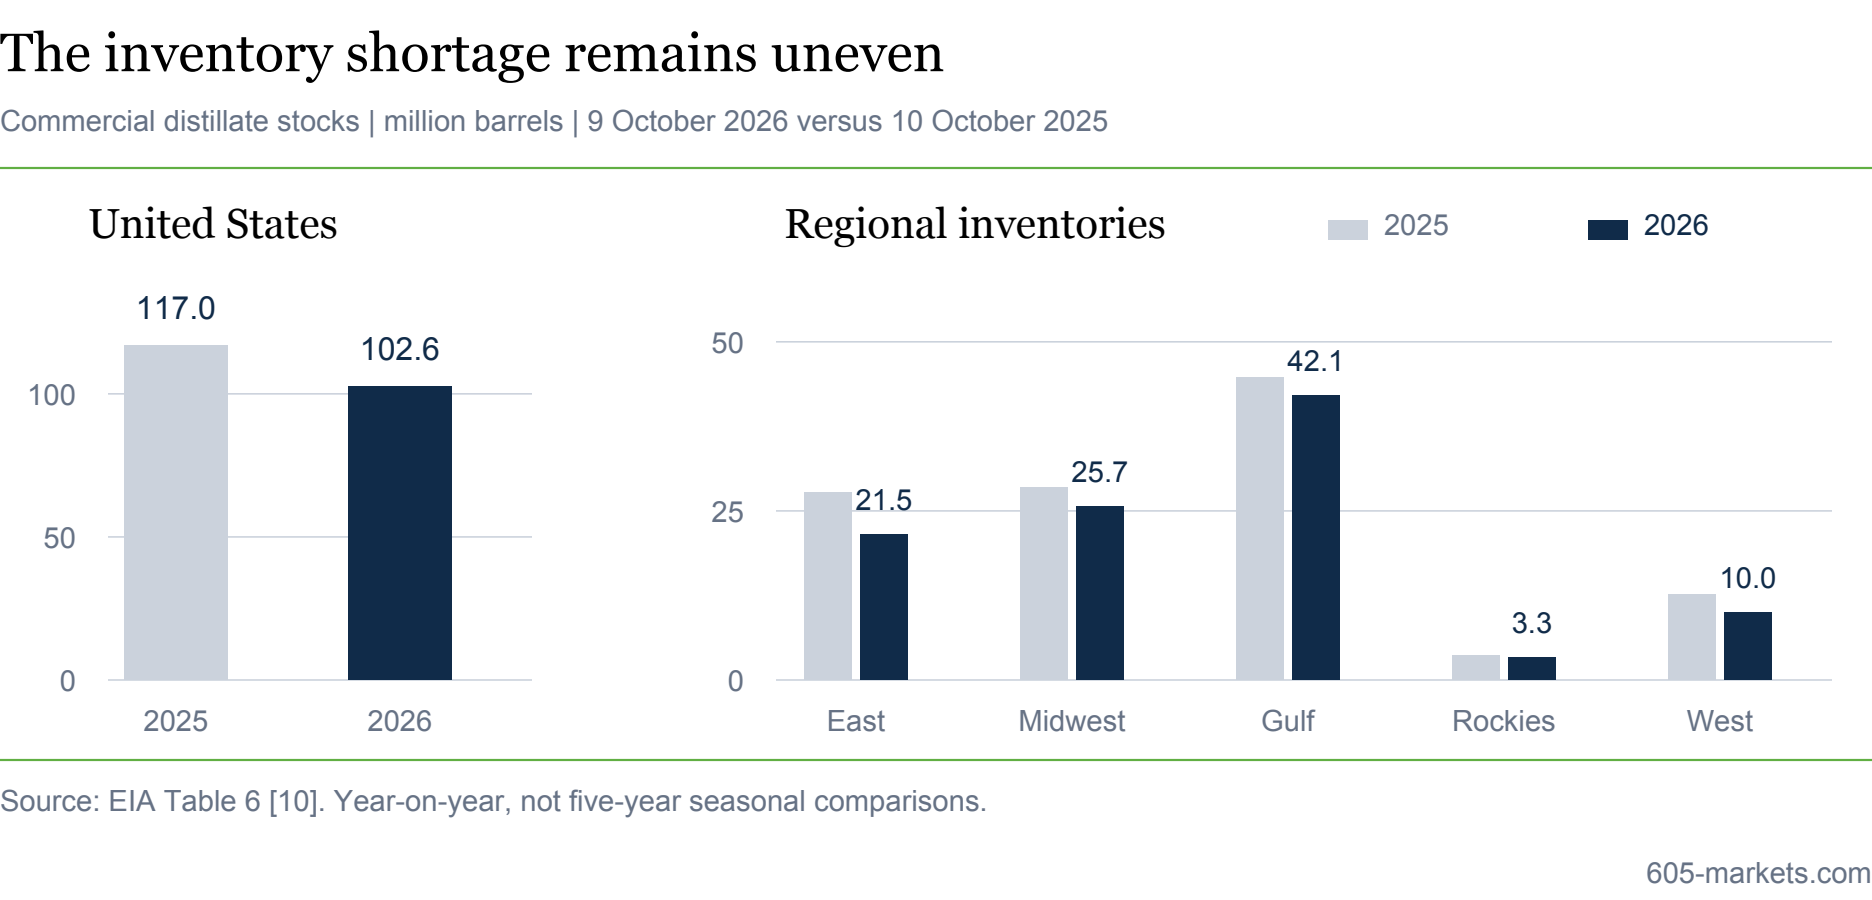
US inventories have continued to fall since the early-October snapshot. In the week ending 9 October, commercial distillate stocks stood at 102.6 million barrels, against 105.1 million one week earlier and 117.0 million in the matched 2025 week. Lower stocks leave less room to absorb an unplanned refinery outage or a sudden increase in heating demand. [10]
The regional constraint is more important than the national total alone. East Coast stocks were 21.5 million barrels, versus 27.7 million a year earlier. Gulf Coast inventories were 42.1 million against 44.7 million. Fuel elsewhere still has to reach the region where it is needed, through pipelines, ports and import routes. A national supply improvement can therefore arrive unevenly at local delivery points. [6, 10]
Seasonal Vulnerability Extends Beyond One Weekly Release
The EIA’s October outlook put September East Coast inventories 32% below their seasonal average and projected a 20%–30% shortfall through winter. This is an external forecast based on inputs frozen on 1 October, so it excludes the next day’s G7 announcement. It describes the starting vulnerability, rather than the effectiveness of that policy response. Sustained regional stock rebuilding would be stronger evidence of relief than one shipment or one weekly increase.
The chart uses matched year-earlier weeks. The seasonal comparisons use the EIA’s 2021–2025 average; the two baselines are distinct. Earlier figures elsewhere in the report remain dated observations.
Our Position, Pricing and Risks
Our core position is that increased crude output and normalizing shipping flows should offer partial relief from current historically high diesel prices, but long refinery repair timelines and depleted diesel inventories will still sustain elevated prices. Even as crude supply and exports recover, refining capacity will recover more slowly, so we expect the diesel crack spread to stay near current levels. Already, we have seen a slight decrease in the spot price for NYH ULSD from its peak of $5.36/gallon in September to its current (10/14) spot price of $5.066/gallon, likely signifying supply relief. Further crude export stabilisation alongside emergency diesel releases should lead to increased diesel price relief.
Operational Challenges Hindering Refining Industry
We must first highlight certain trends in refining. First, damage to refineries in Russia and the Middle East. Strikes in the Russo-Ukrainian war have affected an estimated 30–50% of Russian refining capacity. This represents a total of about 2.0-3.5% of global refining capacity, a sizable amount. Meanwhile, Middle East diesel refining capacity has also dropped due to damage from the Iran War. Together, the geopolitical conflicts in these regions have lowered combined exports by about 1.3 to 1.6 mbpd, representing about 5-6% of global diesel demand. Due to this decrease in refining capacity, we expect that even with adequate crude availability, diesel supply will remain constrained and crack spreads will stay elevated.
Capacity basis: affected refinery capacity is not equivalent to capacity offline or lost diesel output. Columbia’s August assessment distinguished those measures; it does not establish a current October percentage of Russian capacity unavailable. [7]
Second, utilisation rates are elevated. In the United States, specifically, the refinery utilisation rate is at 92.5% and averaged up to 97% during its peaks this year. However, historically, the U.S. utilisation rate hovers around 89%. As normalisation of the crude markets proceeds, we assume that refinery utilisation will eventually decrease as well. Third, depleted crude and diesel inventories, as mentioned before.
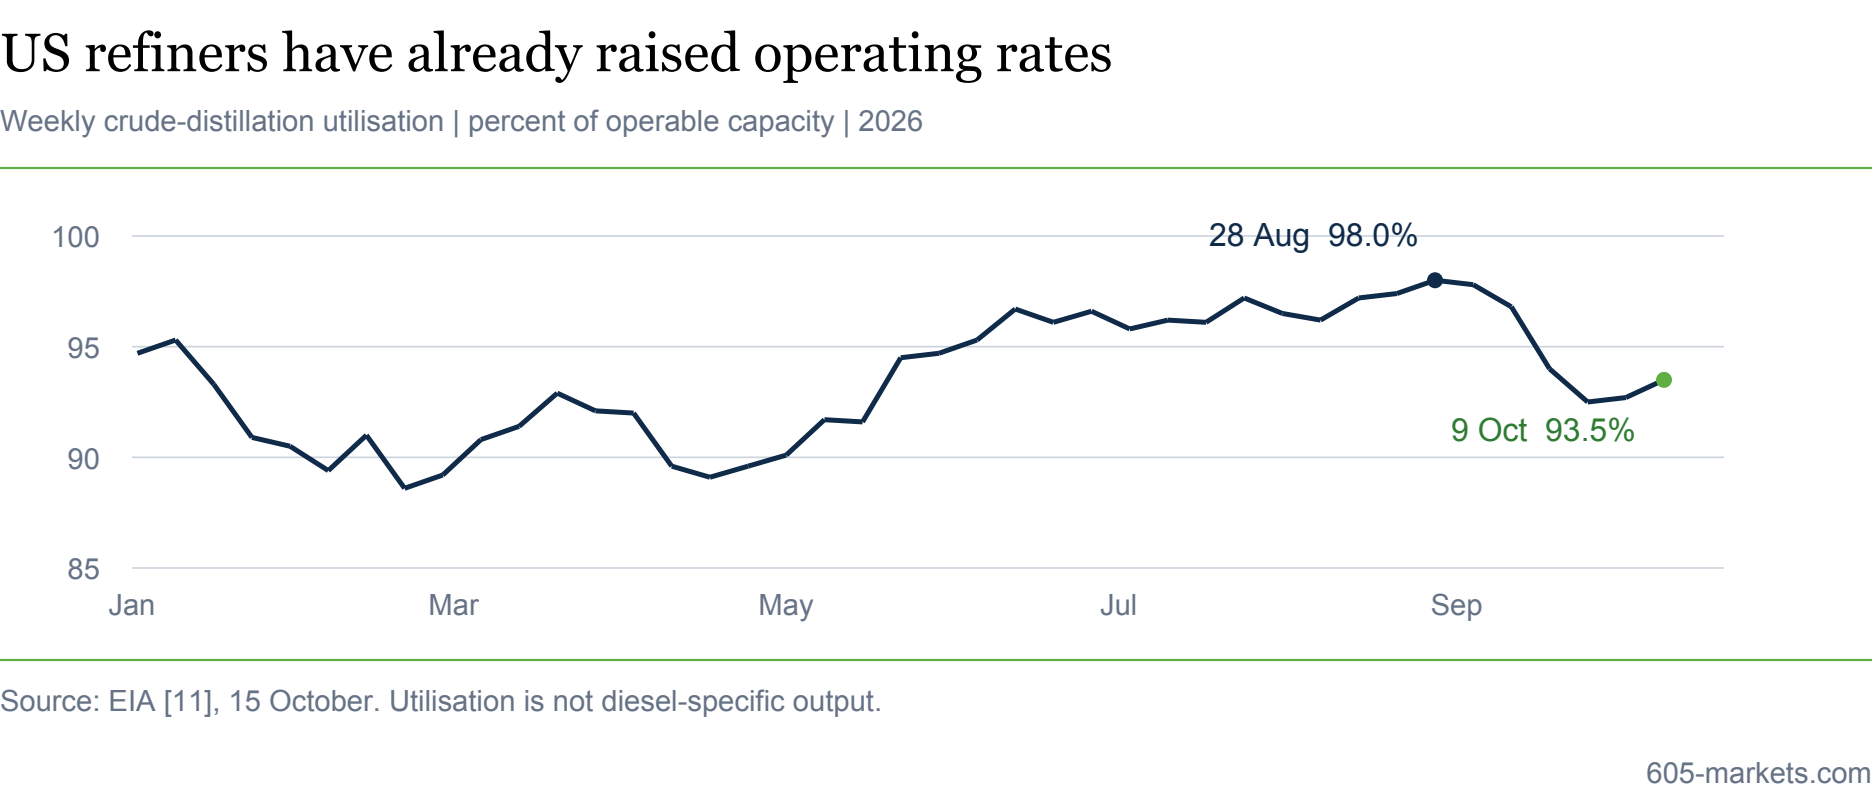
The 92.5% figure in the preceding discussion refers to 25 September. The latest plotted week, 9 October, was 93.5%. Lower operating rates may reflect maintenance as well as crude availability.
Our View Versus Market Pricing
We believe that diesel pricing originates from two primary elements: the availability of crude oil and the refining capacity to process it. All of these trends represent headwinds for the refining industry: as crude exports recover, damaged and near-capacity refineries will not be able to process all of it. We therefore expect NYH ULSD to fall less than crude as more crude becomes available.
In our base case, we believe that NYH ULSD will experience a slight short-term decrease. This is underpinned by greater crude oil availability that stems from more crude exports from the Middle East. This will offer gradual relief as shipping normalises, but middle distillate supply will remain constrained because of low inventories and long repair timelines for damaged refineries. Importantly, we expect diesel prices to decline more moderately than crude prices, reflecting ongoing capacity constraints. The accelerated release of more than 20 million barrels of diesel likely adds further downward pressure on NYH ULSD. We therefore expect the NYH diesel crack to hold near current levels (~$90/bbl) and NYH ULSD to average around $4.50–$4.75/gal over the next three to six months as shipping normalises.
Scenario basis: the price bands below reproduce the supplied assumptions. They are conditional outcomes, without assigned probabilities or an independently calibrated forecasting model. The observed spot reference is dated 14 October; it is not a forward-market consensus.
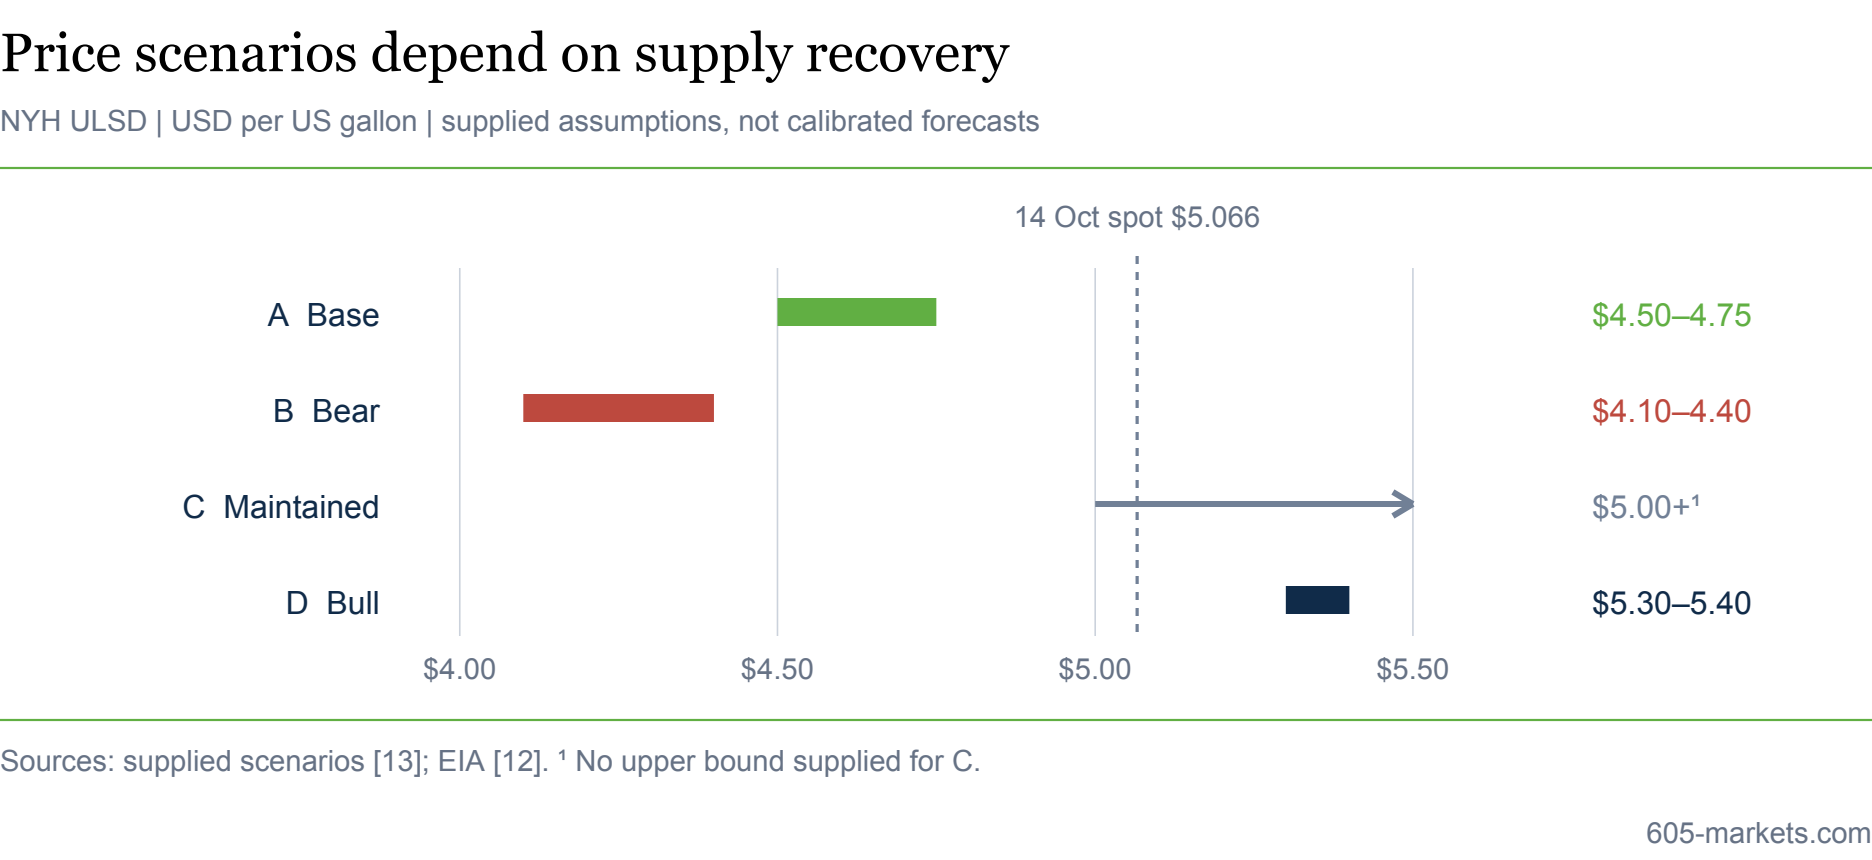
We will also consider three other scenarios. Scenario B, the bear case, involves a faster normalisation of crude exports, leading to a greater supply of crude. Accelerated normalisation of crude shipping will increase crude supply, bringing greater relief to the energy markets. While diesel prices fall sharply, crack spreads will widen as damaged facilities and high utilisation rates restrict refiners from processing additional crude. Scenario C assumes a future market where Middle East crude shipping experiences a slow recovery. Under this, crude remains widely unavailable, and diesel will follow a similar price trend. Under our bull case in Scenario D, we assume significant crude export hindrances. Lower crude supply will result, but emergency diesel releases and Russian diesel agreements will offset supply deficits. As a result, we expect diesel prices to increase, but not to the extent of crude increases.
| New York Harbor ULSD | Crack Spread | Timeline | |
|---|---|---|---|
| Scenario A (Base) Gradual Crude Supply Recovery | $4.50-4.75/gal (↓ 6.2-11.2%) Gradual decline as crude exports improve. | Spread remains elevated (~$90/bbl); refineries absorb the majority of increased crude availability. | 3-6 month gradual price decline with elevated refinery margins. |
| Scenario B (Bear) Faster Crude Supply Recovery | $4.10-4.40/gal (↓ 13.1–19.1%) Faster crude export normalisation drives larger price declines; refinery constraints limit relief. | $100+ Diesel - Crude Widens initially as crude prices fall faster than diesel prices; will narrow as refineries recover. | Rapid initial price decline, then eventually the decrease stabilises as refining utilisation increases. |
| Scenario C (Maintained) Crude Supply remains similar to the current day | ~$5.00+/gal. Persistent crude export obstacles keep diesel elevated. | Remains elevated ($90-100 spread) with minor fluctuations. | Prices initially remain relatively stable, further refinery damage may lead to increased prices. |
| Scenario D (Bull) Severe crude supply disruption | $5.30-5.40/gal (↑ 4.6–6.6%). Severe crude supply disruptions push diesel prices higher. | $75-85 Diesel - Crude Maintained or narrows depending on whether crude costs rise faster than diesel prices. | Sharp initial diesel increase, elevated prices will persist for months. |
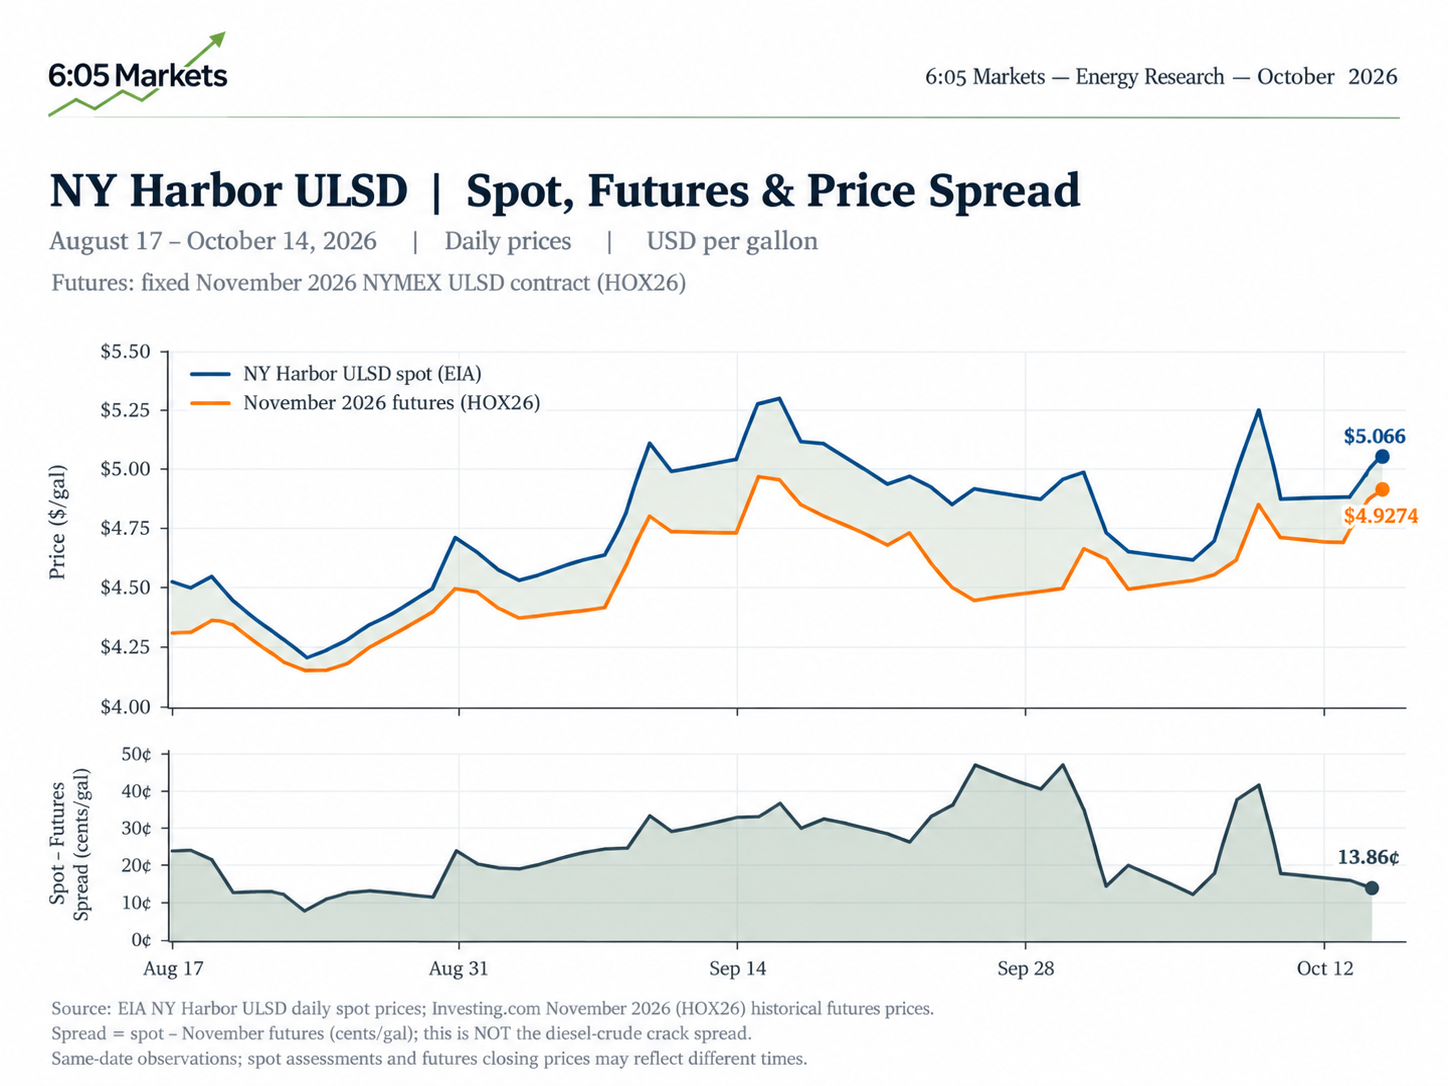
Diesel markets are currently in a state of backwardation. NYH ULSD spot prices are currently exceeding November futures prices, meaning there is a premium for immediate diesel delivery. Recently, the spot-futures spread has narrowed compared to its peak in late September. Decreasing spot prices mean that willingness to pay a premium for immediate diesel decreases, driven by events such as the announcement of the diesel deal with Russia on October 9th.
This dynamic reinforces our base case. First, it demonstrates that spot prices are trending downwards, despite slow progression and futures prices seemingly staying elevated. Second, the Russia deal narrowed the spot premium without lifting futures, which suggests that policy provides temporary relief and volume, not new refining capacity. This means that they can temporarily compress both diesel spot premiums and the crack spread, rather than structurally changing it. Because long-term crack spreads depend on these margins, diesel prices will remain linked to crude and fluctuate based on available refining capacity.
Pricing basis: the retained spot/futures exhibit is an indicative comparison. A tradable backwardation measure requires matched timing, grade, location and a specified futures contract. A smaller spot premium alone cannot isolate the effect of the Russia announcement.
Risks and Challenges to Our Position
The main risk to our position is faster-than-expected refining timelines. If these repairs proceed faster than we had assumed, then global refining capacity will normalise quicker, narrowing the crack spreads that we had planned. Another risk to consider is that higher crack margins may push refiners to run harder and shift yields toward distillate, significantly increasing utilisation rates beyond our expectations. This would also put more downward pressure on diesel prices.
Another risk involves more aggressive government policy. Further announcements of emergency diesel releases may flood the market and drive down spot diesel prices, meaning crack spreads will also remain narrower in the short-term. In the long-term, however, we would expect the spread to widen again since diesel inventories would need to be replenished.
Ultimately, our base case assumes that shipping will normalise alongside the crude supply. Disruptions or higher insurance and freight rates may hinder crude exports from the Middle East.
Conclusion
Crude recovery is necessary for diesel supply to normalise, but it is only one part of the process. Functioning refineries must convert that crude into distillates, and those products must reach markets with depleted stocks. Emergency releases can accelerate price relief while repair work continues. This leaves room for diesel prices to fall even while the underlying product balance remains tight.
Our central view remains that diesel normalisation will lag the recovery in crude exports. We would judge that view against delivered fuel volumes, exportable refinery output, regional inventory rebuilding and comparable diesel premiums. Sustained improvement across those measures would weaken the case for elevated margins. Continued deficits despite improving crude availability would reinforce it. The clearest sign that this view is wrong would be supply meeting demand without further inventory draws.
New York Harbor ULSD spot will average between $4.50 and $4.75 per gallon from 18 January to 18 April 2027.
Series New York Harbor ULSD spot ($/gal) Entry 5.07 Range between 4.50 and 4.75 Across 18 Jan - 18 Apr 2027 Written 14 Oct 2026
Resolves against EIA series PET.EER_EPD2DXL0_PF4_Y35NY_DPG.D on the average of its readings from 18 Jan - 18 Apr 2027. Not investment advice.
Data Sources
- [1] Reuters — The oil market’s center of gravity is moving east. 12 October 2026. September exports versus eight pre-conflict weeks; accumulated refinery outages reported 12 October.
- [2] IEA — Oil Market Report September 2026. 11 September 2026. August 2026 net diesel/gasoil exports versus February.
- [3] EIA — Weekly Petroleum Status Report 7 October 2026. 7 October 2026. Week ended 2 October; Tables 1 and 6; monthly spot prices January–September.
- [4] Kpler — Middle East refining under pressure. 20 August 2026. Earlier August refinery-throughput assessment, not October capacity.
- [5] EIA — What goes into diesel prices. 18 September 2026. Price and crack-spread definitions.
- [6] EIA — Short-Term Energy Outlook October 2026. 6 October 2026. September East Coast stocks and winter external forecast; inputs finalised 1 October.
- [7] Columbia CGEP — Beyond Crude Iran War Reveals Refined Products as an Energy Security Blind Spot. 28 August 2026. Earlier refining, export and emergency-stock composition assessment.
- [8] G7 — Leaders’ statement on global energy security and market stability. 2 October 2026. Release commitments over four months and diesel frontloading.
- [9] IEA — Governing Board statement on energy markets and security. 15 October 2026. March collective-action delivery status and accelerated diesel plans.
- [10] EIA — Weekly Petroleum Status Report 15 October 2026 Tables 1 and 6. 15 October 2026. Week ended 9 October versus 2 October and 10 October 2025.
- [11] EIA — Weekly US refinery operable-capacity utilisation. 15 October 2026. Weekly January–9 October 2026 observations.
- [12] EIA — New York Harbor ultra-low sulphur diesel spot prices. 15 October 2026. Daily spot assessments through 14 October 2026.
- [13] 6:05 Markets — Supplied scenario assumptions and original draft. Supplied draft, dated 18 October 2026. Conditional three-to-six-month scenario ranges as supplied by the authors.