Are US Crude Inventories Running Low & What Does This Mean?
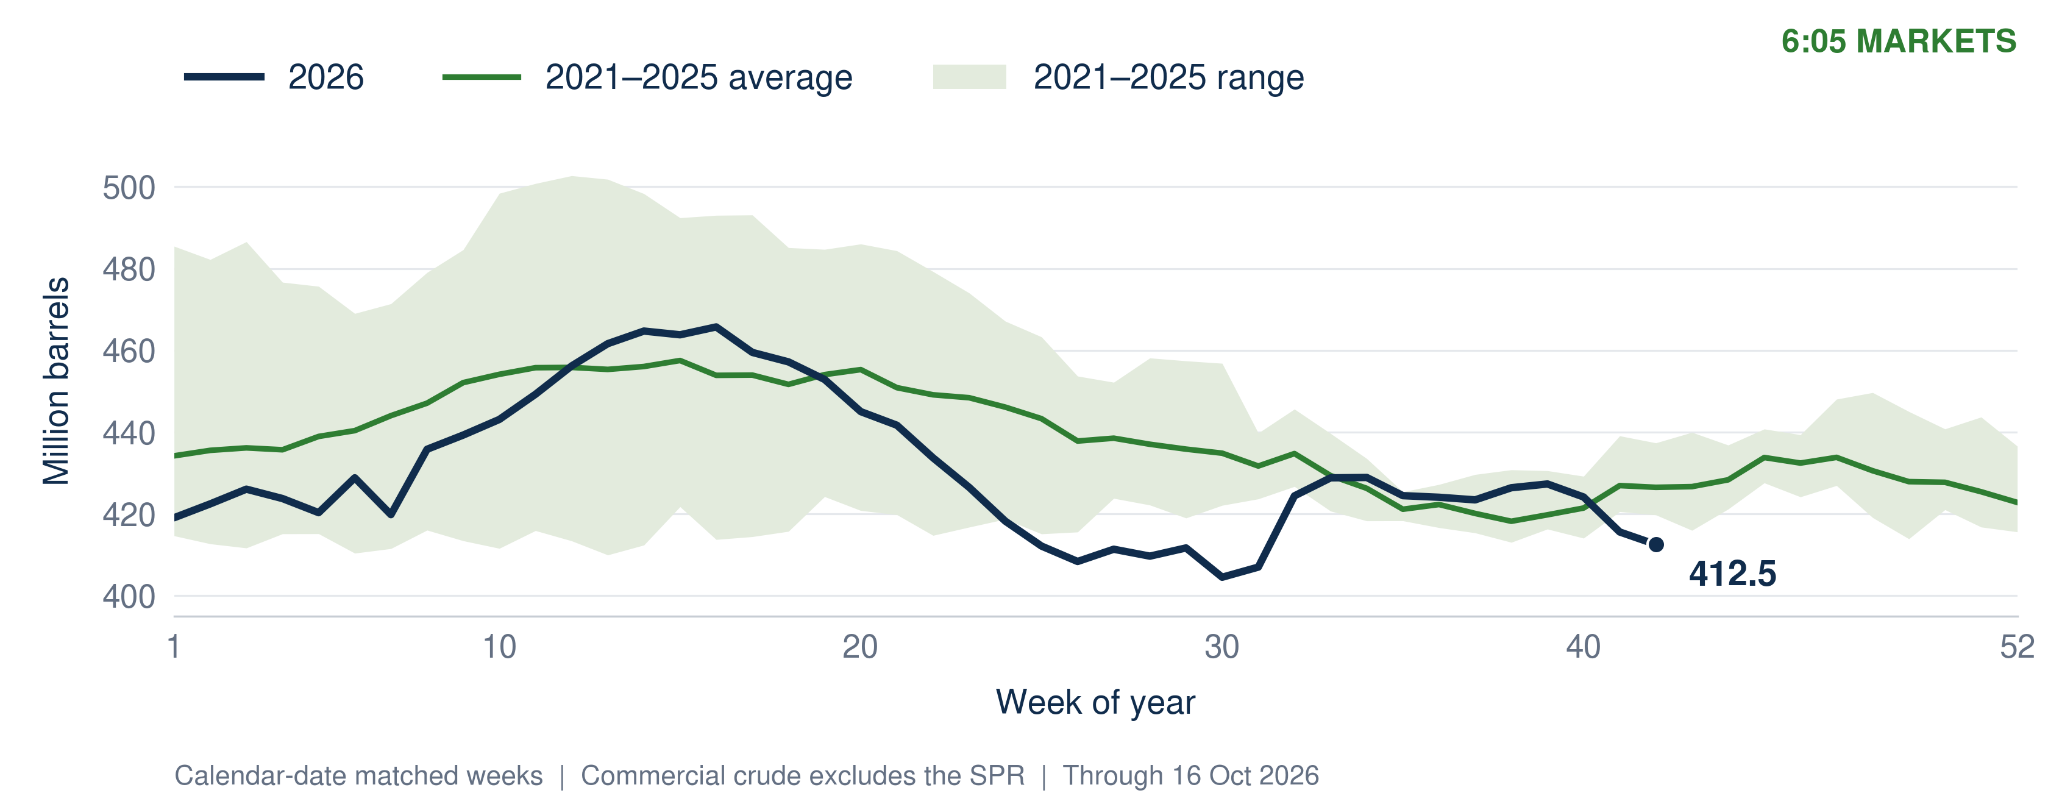
US commercial crude inventories are below their seasonal norm, with recent draws indicating unusual tightening. In the week ending 16 October 2026, stocks excluding the Strategic Petroleum Reserve stood at 412.5 million barrels, down 13.9 million barrels from 18 September and 3.3% below the calendar-matched 2021-2025 average of 426.5 million barrels. Over the equivalent four-week period, stocks historically increased by 8.3 million barrels on average. Inventories are therefore both below average and falling at a time when they usually build, although this does not establish an outright shortage.

Executive Summary
Two pressures help explain the balance: strong refinery demand and disrupted domestic production. Four-week refinery crude inputs averaged 16.5 million barrels per day, 4.2% above a year earlier, while the latest utilisation was 93.4%. Hurricane Isaias forced Gulf production shut-ins, and national output fell 410,000 barrels per day in the latest reporting week. Our 8-12-week base case is for inventories to remain below their seasonal average, assuming refinery runs remain relatively strong, with production restarts slowing further draws. The main risk is a faster supply recovery alongside weaker refinery demand, allowing stocks to rebuild. A persistent seasonal deficit would be supportive for WTI; a narrowing gap would weaken that price signal.
Key Numbers
| Commercial crude stocks | Four-week stock change | Gap to five-year average | Refinery utilisation |
|---|---|---|---|
| 412.5 mbbl | −13.9 mbbl | −3.3% | 93.4% |
Figure 1 · US Crude Stocks in Seasonal Context
Beyond the Headline Inventory Number - Monty
What Are We Measuring?
We are measuring US commercial crude inventories, defined as the total number of barrels of unrefined crude oil held in storage within the United States, excluding the Strategic Petroleum Reserve (SPR). The SPR, owned and controlled by the US government, is the world’s largest supply of emergency crude oil and serves as a safeguard against severe disruptions in the global oil supply. Excluding the SPR in these measurements is useful, as it allows us to focus on changes driven by market forces rather than government policy.
It is important to acknowledge that releases from the SPR move crude oil into commercial stocks and can understate decreases in US commercial crude inventories. However, this effect has been small over recent weeks, with SPR levels decreasing by almost 2 million barrels between 25 September and 23 October, while commercial inventories fell by around 16.7 million.
One Weekly Release or a Persistent Trend?
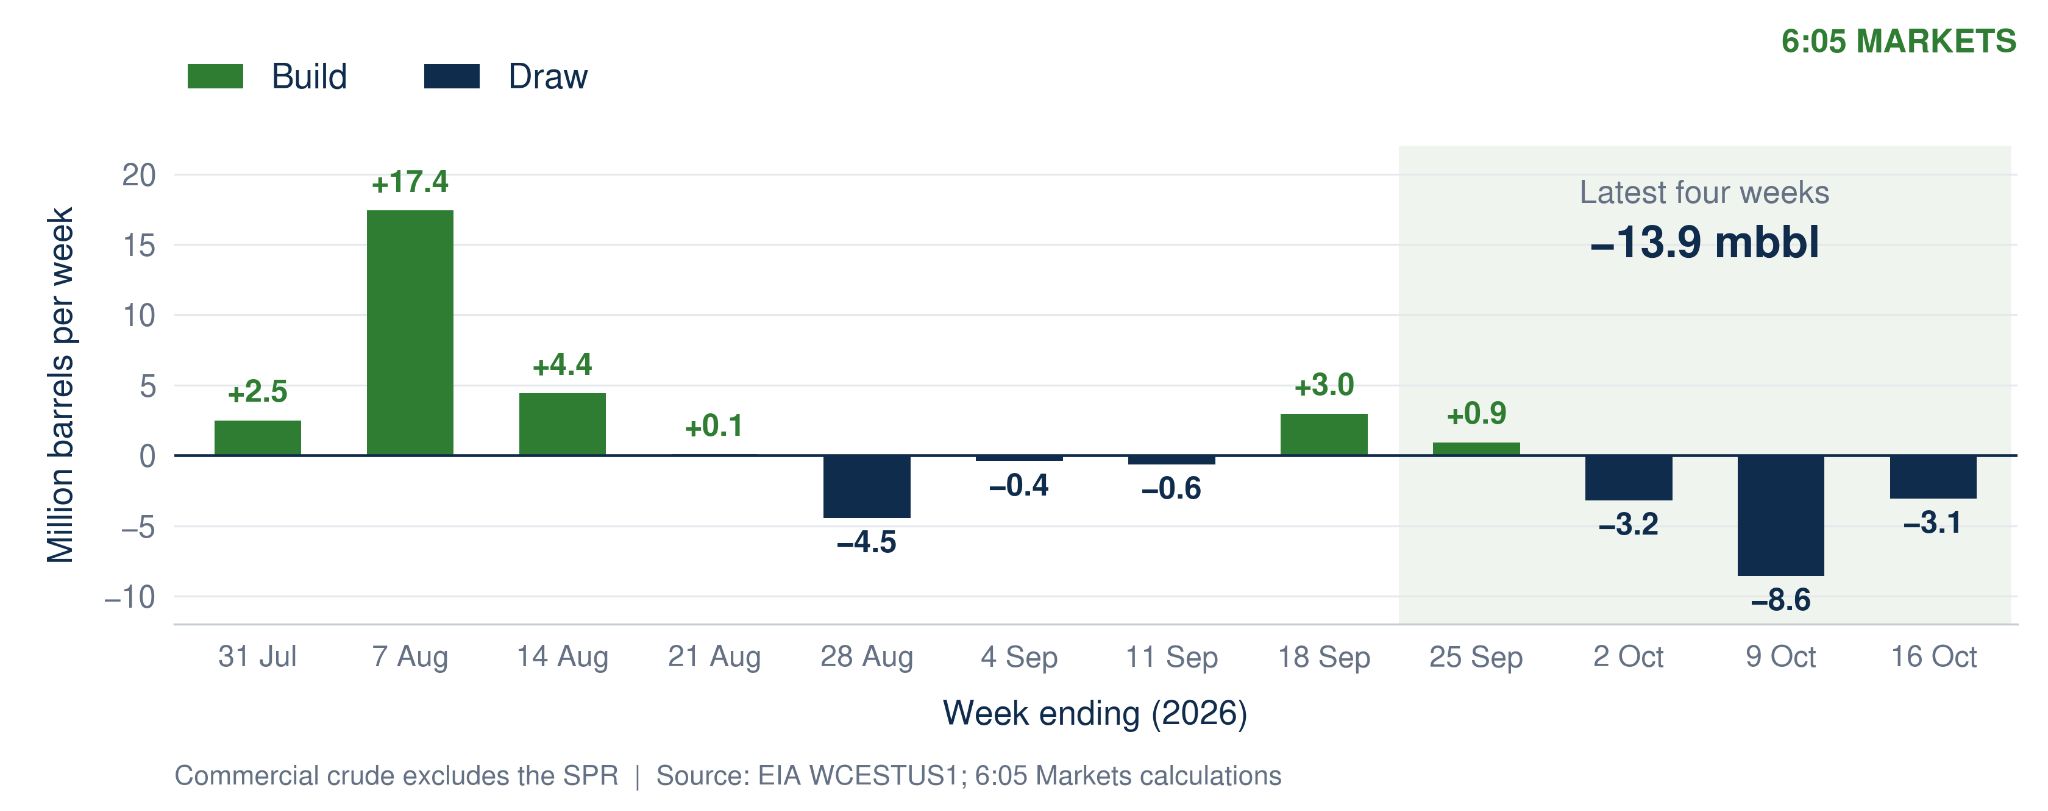
US commercial crude inventories fell by almost 1.9 million barrels to a total of 410.6 million in the week of October 16-23. This constitutes a cumulative four-week decrease of 16.7 million barrels, further contributing to the general downward trend of commercial crude stocks in the last 10 weeks and pointing to a persistent trend rather than a one-week anomaly. These consecutive weekly draws highlight a sustained tightening of the commercial supply of US crude oil, with levels falling during a period when they would usually rise.
Figure 2 · Recent Weekly Builds and Draws
Is the Move Unusual for This Time of Year?
The autumn months are usually a period of growth for US commercial crude inventories due to reduced demand compared to the driving season in the summer and the heating season in the winter. As a result, refinery maintenance is typically scheduled for this time of year. Yet, in the week ending 16 October, crude stocks stood at 412.5 million barrels, 3.3% below the calendar-matched 2021-2025 average of 426.5 million. Over the equivalent four-week period, stocks have historically increased by 8.3 million barrels, whereas between 18 September and 16 October 2026 they fell by 13.9 million, a net swing of -22.2 million barrels of crude oil. This is the lowest level of inventory for this time of the year in the five-year comparison period [see Figure 1].
However, this historical comparison certainly has limitations, such as including some particularly atypical years with regard to the global oil supply. For example, 2021 was significantly impacted by post-COVID disruptions, and 2022 involved hundreds of millions of barrels of crude oil being released from the SPR in response to the Russian invasion of Ukraine.
Domestic Production: Is Supply Keeping Up? - Tomas
The Recent Production Trend
US crude oil production is stable on the year. EIA’s four-week average was 13.73 million barrels per day in the week ending Oct 23, 2026. That is up 0.095 mb/d (0.7%) from 13.635 mb/d a year earlier. Three months ago, oil production was 0.099 mb/d higher than it is now (13.83 mb/d). Furthermore, the peak four-week average in the last 13 weeks was 13.954 mb/d, in the week ending Oct 2, 2026, 0.234 mb/d higher than current levels. This is also the highest four-week average for all of 2026.
Temporary Disruption or a Lasting Change?
The decline from the October peak seems temporary. Weekly Lower 48 output fell from 13.49 mb/d (week ending Oct 2) to 13.21 (Oct 9) and 12.76 (Oct 16). The following week, it recovered to 13.51. This lifted total US weekly output to a 2026 high: 13.99 mb/d. Alaska’s production stayed between 0.47 and 0.51 mb/d, so it didn’t influence the dip.
The timing corresponds with Hurricane Isaias, which shut in approximately 71.5% of the current daily oil production in the Gulf of Mexico. This is consistent with the dip. The Marine Minerals Administration (MMA) estimated that 25% of Gulf of America oil production was shut in on Oct 7, rising to a peak of 71.5% on Oct 9 and subsequently falling to 57.5% on Oct 11, 29.6% on Oct 12, and 9.9% on Oct 14. The week ending Oct 16, when EIA’s Lower 48 output was at its lowest, covers the bulk of the shut-ins. By the week ending Oct 23, output had recovered to 13.51 mb/d.
Figure 3 · US Crude Production is 0.1 mb/d Above Last Year Despite Hurricane
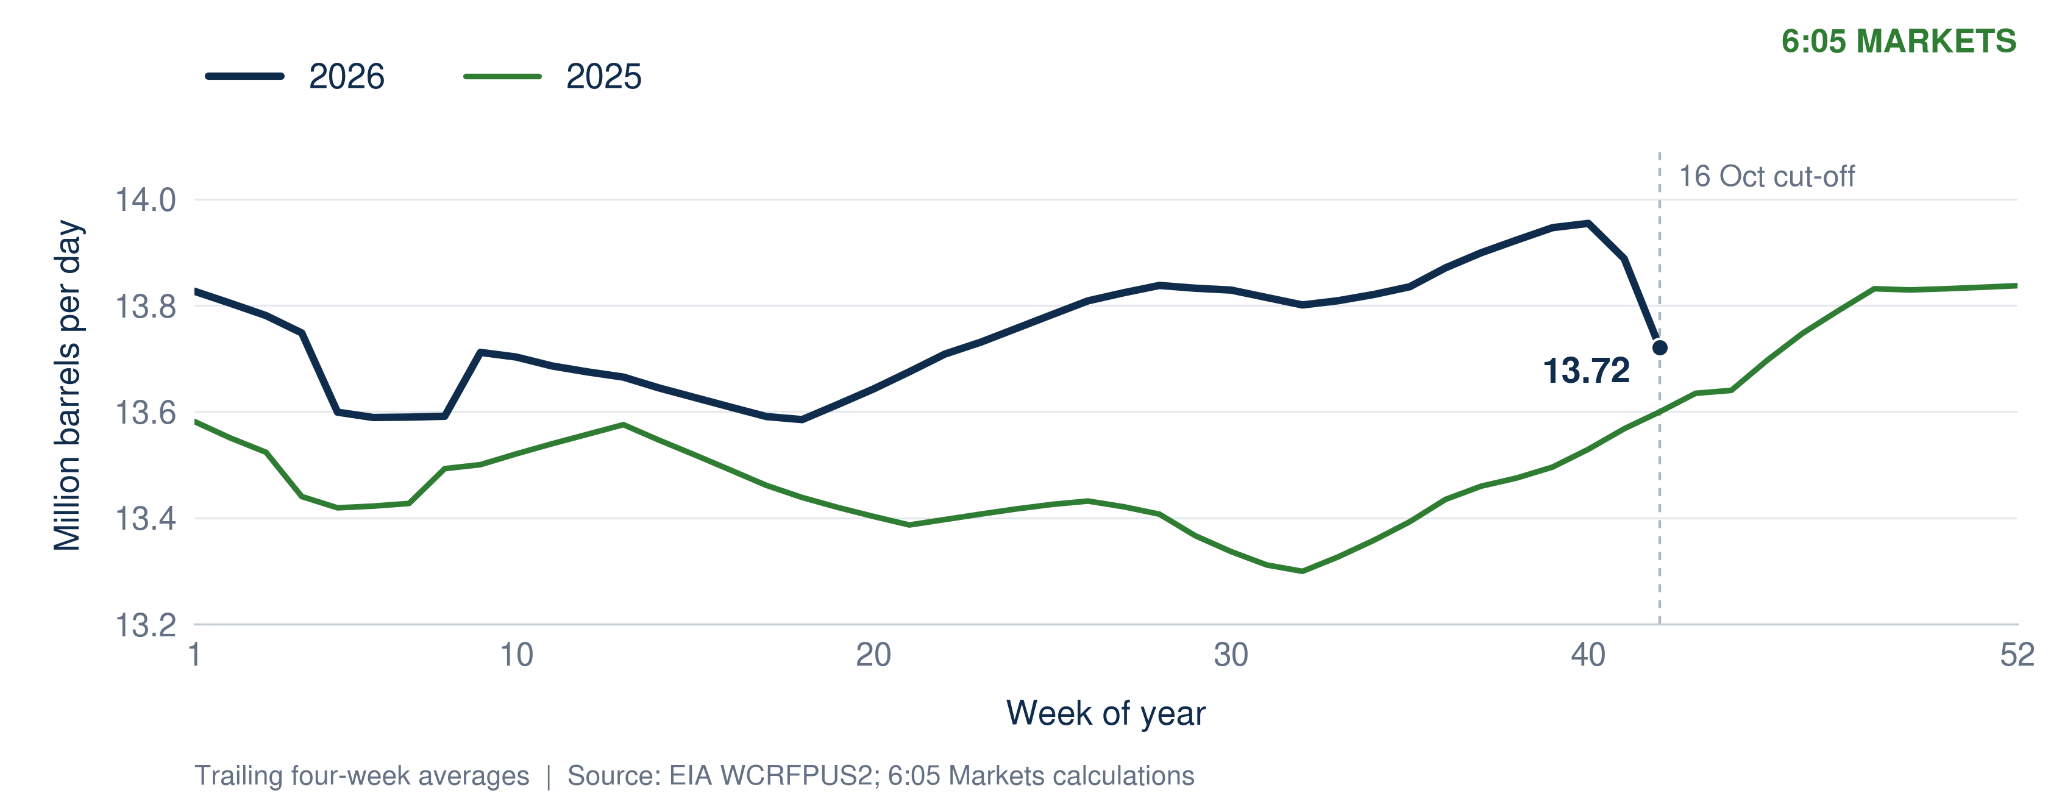
Chart takeaway: US crude output is up roughly 0.10 mb/d on the year (13.73 vs 13.64 mb/d), despite a 0.23 mb/d slide from its early October peak of 13.95 mb/d.
What This Means for the Inventory Balance
Domestic production does not explain most of the recent stock draws. Commercial crude stocks fell 8.6 million barrels in the week ending Oct 9, which corresponds to when Isaias began shutting in Gulf production. Output that week was only around 0.30 mb/d lower, a loss of roughly 2 million barrels, and net imports fell from 2.08 to 1.48 mb/d. Stocks have since fallen another 5.0 million barrels to 410.6 million. This is 5.3 million barrels below a year ago.
Output has fully recovered to 13.99 mb/d, yet stocks still fell 1.9 million barrels in the last week. Production plus net imports (15.51 mb/d) trailed refinery runs (16.53 mb/d) by about 1.0 mb/d, which points to trade and refinery flows. The trade section supports this claim. As shown below, crude imports are decreasing as exports rise. Reduced net inflows, rather than weaker domestic output, are the main factor behind the stock draws.
Section conclusion: Domestic production is not the reason why stocks are falling. The hurricane removed about 2 million barrels in the week ending Oct 9, which is well short of the 8.6 million-barrel draw. Furthermore, stocks kept falling after weekly output recovered to a 2026 high.
Imports and Exports: The Overseas Link - Fergus
How Much Crude Is Entering the US?
The current four-week average of crude imports into the US from all countries is 6.09m b/d. This figure is substantially lifted by the week ending Oct 2, which had imports of 6.84m b/d. Without this outlier week, the current four-week average would be 5.84m b/d. Compared to the 6.63m b/d average of the preceding four-week period, headline numbers show an 8.2% reduction in imports, equating to 0.54m b/d. Excluding this single high week would reveal a fall of 11.9%. This trend is generally persistent, but one outlier week means the scale of the downturn is not fully captured in the four-week average figures.
Imports are falling in the short term but remain at a higher level than in the same period last year. The current four-week average is up 2.8% from last year’s value of 5.92m b/d; the four preceding weeks are up 5.3%. Similar to this year, crude imports fell between these two periods last year, but by around 6.0%, compared to this year’s 8.2%. We are therefore seeing a similar trend but at a steeper rate.
How Much Crude Is Leaving the US?
The four-week average of crude exports rose to 4.41m b/d from 3.78m b/d in the preceding four weeks, an increase of 16.7%. The first four-week period was a short-term dip in exports; since then, the rise has been largely persistent, with three of the four weeks averaging 4.57m b/d or higher. However, the accuracy of EIA’s data is questioned by commodity-tracking firm Kpler, which said that observed loadings for the week of Oct 23 were about 1m b/d below EIA’s figures. If this is the case, the current average is 4.16m b/d, meaning an increase of 10.1%. Either way, the positive direction stands. Hurricane Isaias on Oct 9 is also reported to have caused 0.4m b/d of lost crude production, which coincides with a fall in exports to 3.44m b/d. Last week saw a recovery from this slump.
Crude exports also rose across this period last year, but by only 0.10m b/d to 4.16m b/d (2.5%). Current crude exports are 0.25m b/d higher than last year.
Figure 4 · Crude Exports Down 21% from May Peak, Imports Up 7%
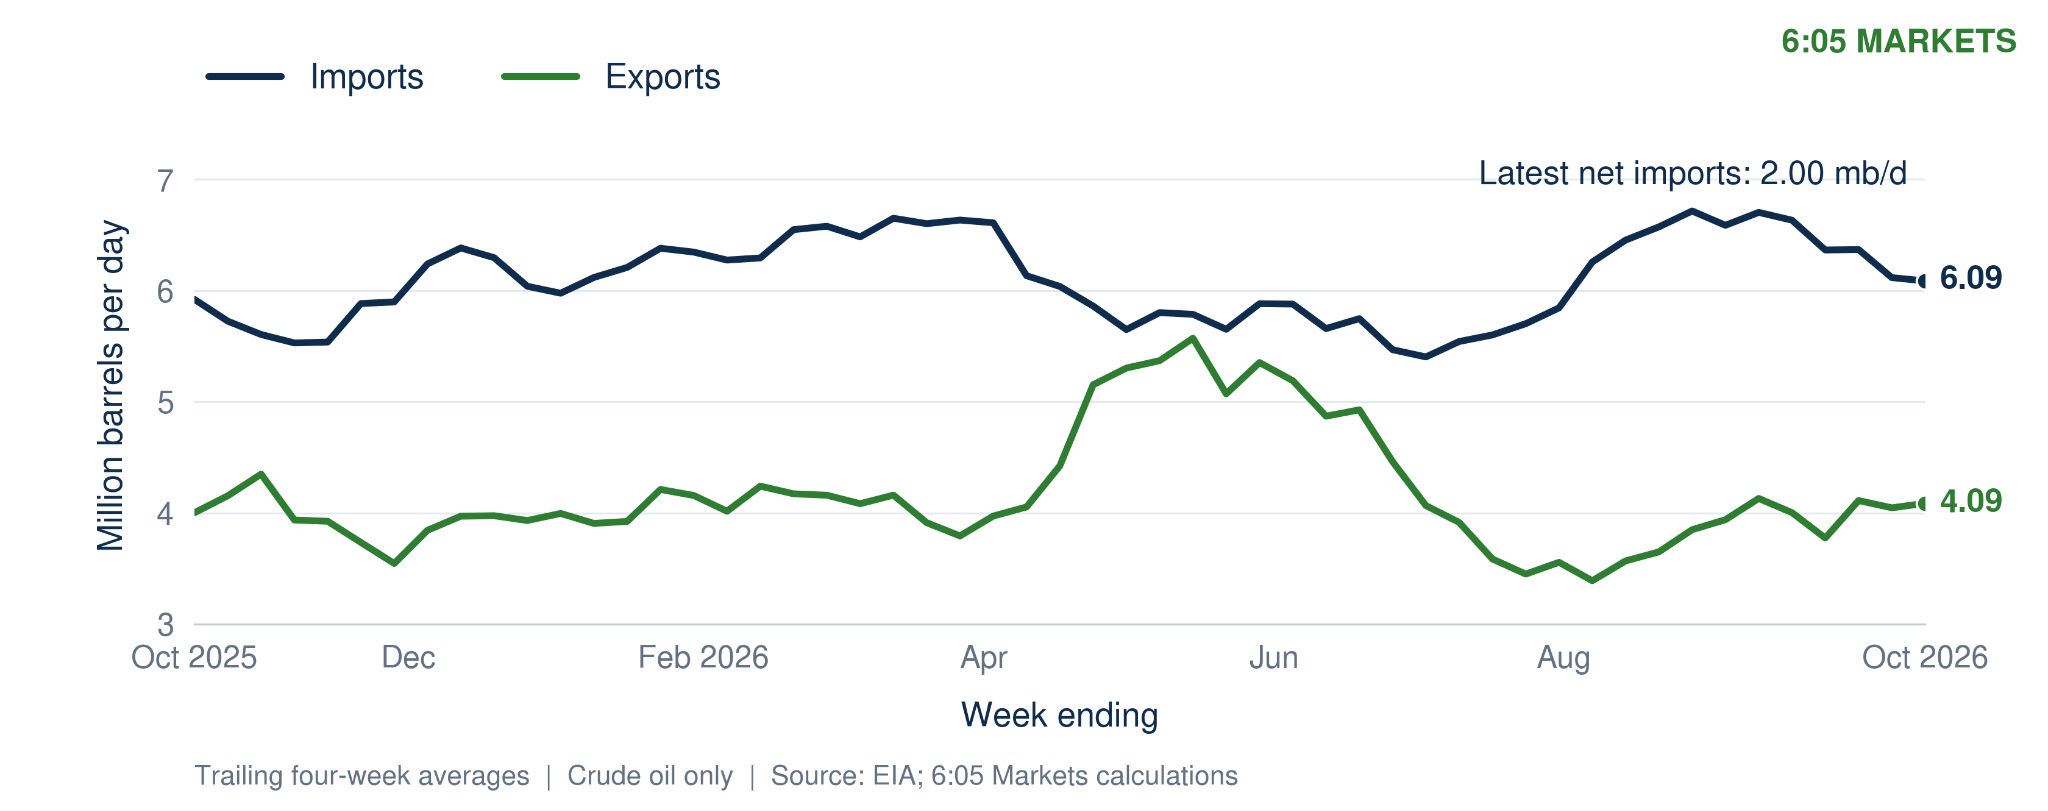
Chart takeaway: U.S. crude exports have fallen 21% from their May record four-week average; imports have not followed. The war-driven export surge has unwound, and the U.S. is again a net importer of about 2.0m b/d.
The Net Effect on Inventories
Changes in net trade have made less crude available to the domestic system. Net crude imports averaged 1.88m b/d over the four weeks to Oct 23, down 0.74m b/d (28%) from the preceding four weeks, as exports rose and imports edged lower. With production also down 0.2m b/d (partly due to Hurricane Isaias’s shut-ins) and the SPR contributing 0.1m b/d less, crude available to the domestic system fell about 1.0m b/d between the last two four-week periods. Refinery inputs fell by only 0.4m b/d, so commercial stocks moved from a small build to a 0.6m b/d draw. Net trade was the largest single contributor, but the stock change is not explained by trade alone. Kpler also disputes the latest export estimate; if it is right, the fall in net imports is nearer 0.5m b/d.
Product Demand: A Cross-Check on Tightness - Audrey Levin-Kim
What Do Gasoline and Distillate Stocks Show?
Both US gasoline and distillate inventories remain largely below their seasonal averages, providing reinforcing evidence of a tightening in crude markets. According to the Energy Information Administration (EIA), gasoline inventories in the week ending October 16, 2026 were approximately 5% below their typical five-year average, while distillate fuel oil inventories were around 9.3% below their typical average. With both of these deficits exceeding the 3.3% shortfall in commercial crude inventories, there is also reason to believe that this tightness extends beyond unrefined oil into products supplied by refineries.
However, recent inventory changes have revealed differences between the two products. Gasoline stocks fell by around 0.8 million barrels over the four weeks leading into October 16, including a 3 million barrel draw in the latest week, which indicates that gasoline stocks are not being rebuilt despite relatively strong refinery activity. On the other hand, despite the latest week recording a 1.7 million barrel build, distillate inventories have experienced a larger four-week draw of approximately 3.1 million barrels. And so, while distillate inventories remain significantly below normal seasonal levels, the latest increase suggests that the pace of tightening may be easing.
Are Fuel Deliveries Supporting the Story?
In examining the EIA’s four-week average of product supplied, a proxy for petroleum consumption, for the four weeks ending October 16, 2026, US gasoline product supplied averaged 8.7 million barrels per day, an increase of 1.5% in comparison to the corresponding period in 2025. This suggests that gasoline demand has remained relatively resilient, helping explain why gasoline inventories have been struggling to rebuild despite the elevated refining activity.
Distillate product supplied, however, averaged 3.9 million barrels per day, indicating a 2.4% year-on-year decline. This presents a slightly different picture, with domestic distillate deliveries weakening even as inventories remain substantially below their seasonal average. Consequently, stronger US consumption alone is not able to explain this tightness in distillate stocks.
International demand offers an alternative explanation. On October 22, Reuters reported that US refineries had maintained an unusually high operating rate during 2026, supported by strong margins and international demand for distillate exports. This is also consistent with the International Energy Agency’s October report, which identified significant disruptions to global diesel supplies, particularly from Russia and the Middle East.
However, EIA does caution that product supplied measures movements through the primary supply chain rather than direct consumer purchases. Reporting delays, weekly volatility, and changes in trade flows can therefore skew these figures. Although using four-week averages can potentially reduce some of this volatility, it does not eliminate it. Distillate exports, specifically, must be considered before attributing falling inventories entirely to domestic demand.
Figure 5 · Crude and Product Stocks: A Seasonal Cross-Check
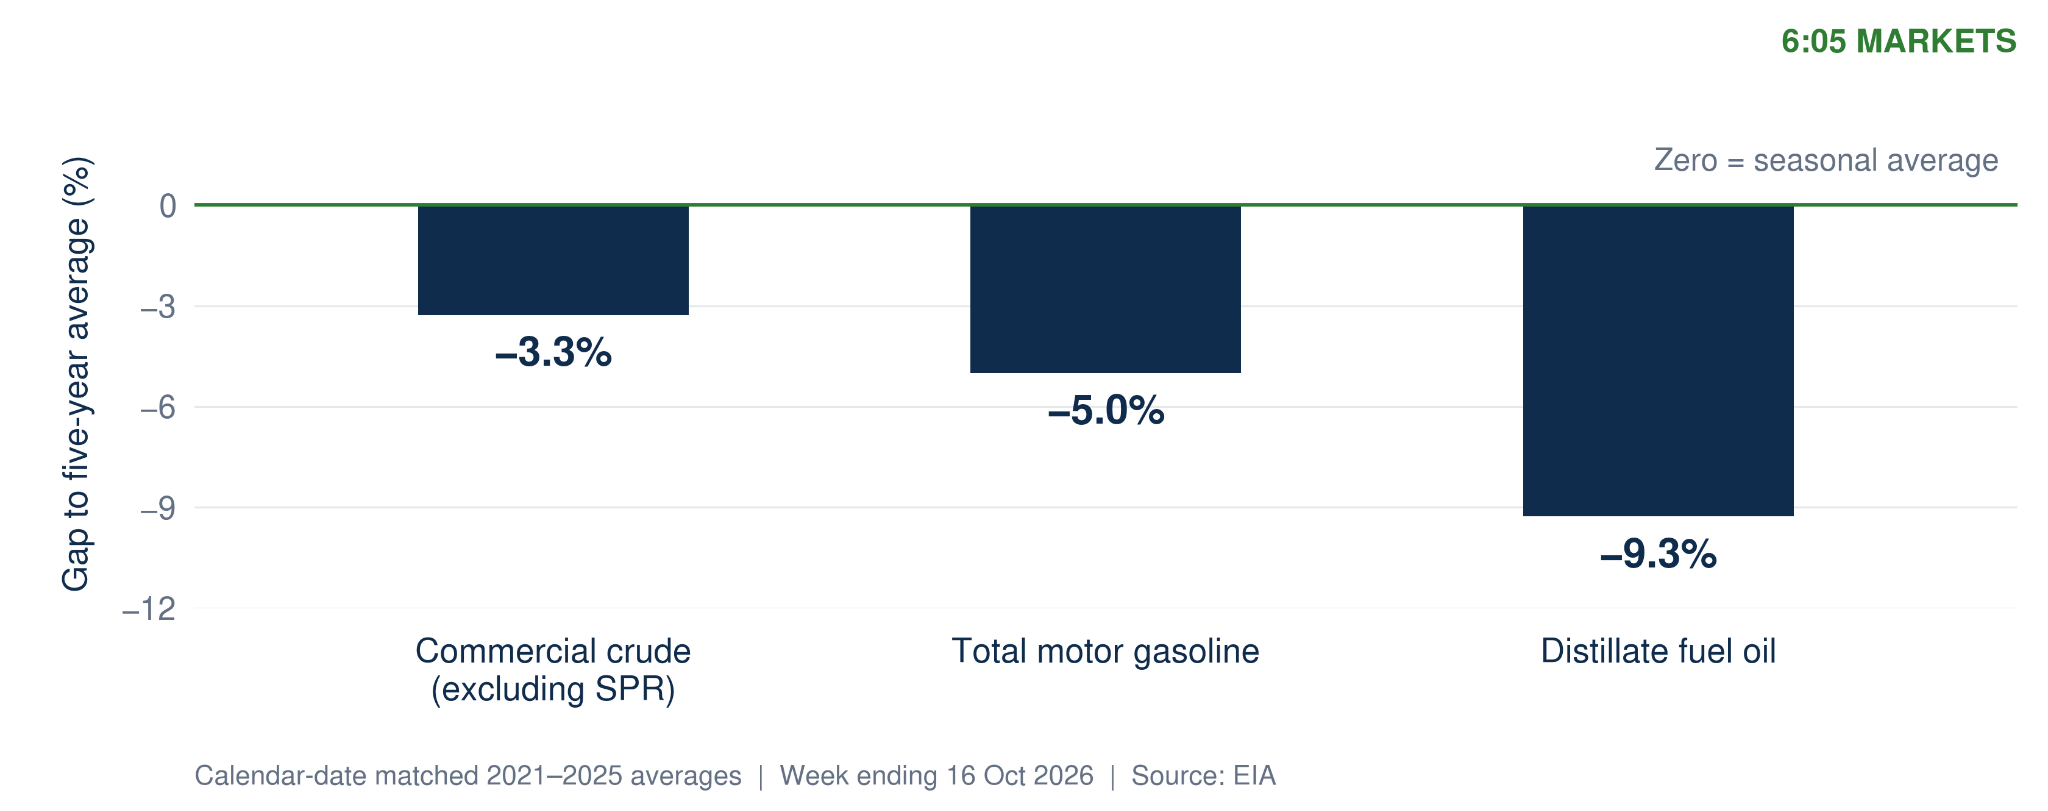
Chart takeaway: Distillate inventories are 9.3% below their usual five-year seasonal average, compared with 5% for gasoline and 3.3% for crude, indicating that refined product tightness is particularly concentrated in diesel and heating oil.
A Consistent Signal, or a Mixed One?
The evidence broadly supports a tightening in the petroleum market, but with differing drivers. While gasoline inventories remain below normal alongside stronger domestic deliveries, distillate stocks have become even more constrained despite weaker US product supply. This points towards international demand and export activity being important contributors to distillate tightness.
The competing explanation is that inventory declines may partially reflect changes in trade flows, refinery operations and product movement timings, rather than a sustained increase in final consumption.
Nevertheless, product inventories overall add moderate confidence to the crude-tightening thesis, as elevated refining activity has not produced a sustained stock rebuild. However, mixed domestic demand indications suggest the market’s tightness is a reflection of a combination of supply constraints, international demand, and trade flows, rather than a broad acceleration in US fuel consumption.
What Do Inventories Mean for Oil Prices? - Keira
A Physical Signal, Not an Automatic Price Forecast
Inventories are one of many components that drive crude oil prices, but they do not directly define price. Weekly data can show the direction, magnitude, and seasonal position of stocks, but it cannot directly isolate the cause of a draw or show the response of the market relative to expectations. Falling inventories may push oil prices upwards, but the significance of the draw is dependent on other factors (magnitude, seasonal context, etc.). Importantly, prices respond to changes in inventory relative to market expectations.
For the week ending October 16, 2026, U.S. commercial crude inventory (excluding the Strategic Petroleum Reserve) stood at 412.5 million barrels, down from the previous week’s 415.6 million barrels, and 3.3% below the seasonal five-year average. This represents a draw of approximately 3.1 million barrels (0.74% of the previous week’s stock). A single weekly decline does not immediately indicate a structural supply shortage, as inventory fluctuations may reflect shifts in domestic production, refinery activity, and imports and exports. As stated by Andrew Lipow (President of Lipow Oil Associates), it is possible that part of the draw “happened to be the high level of exports that we saw during the past week, which was partially offset by an increasing amount of imports” (Reuters).
The significance of a decline depends on whether inventories are consistently falling and how current stocks compare with historical seasonal averages. A longer-term draw that pushes inventories well below typical levels would present stronger evidence of tightening conditions than one weekly decline.
Recent inventory data provides relatively supportive evidence of tightening market conditions. Crude inventories declined from 426.4 million barrels in the week ending September 18 to 412.5 million barrels in the week ending October 16, representing a monthly reduction of 13.9 million barrels, meaningfully more significant than last week’s decline in isolation. Over this time, WTI fell from $103.54 to $99.93, which goes against the typical expectation for constrained supply and indicates that other factors were at work.
However, the composition of inventory has changed in varying ways in the last four weeks. Crude stocks fell 14 million barrels, gasoline fell by 0.8 million barrels, and distillate fell by 3.1 million barrels. In the week ending October 16, crude fell by 3.1 million barrels, gasoline fell by 3.0 million barrels, and distillate increased by 1.7 million barrels. This suggests that the weekly and monthly tightening was not uniform across products.
How Has WTI Behaved?
WTI held an average price of $99.93 for the week ending October 16, 2026. WTI’s substantial year-over-year appreciation despite modest changes in inventory suggests that U.S. inventory levels are insufficient to fully explain the price performance. While declining inventories tend to put upward pressure on price, WTI also reflects expectations about future supply, demand, and geopolitical risk. Potential alternative drivers include OPEC+ production policy, international supply, and changes in anticipated oil demand, which may influence price even when U.S. inventories change relatively little. At its October 4 meeting, OPEC+ chose to keep output consistent with its previously set value. This decision was the latest in a series of consecutive pauses and was consistent with market expectations, suggesting a limited immediate price impact. However, general disruptions associated with the Iran conflict have constrained exports from affected OPEC+ countries, meaning that their production targets have not necessarily translated into greater supply.
Figure 6 · WTI Price Context
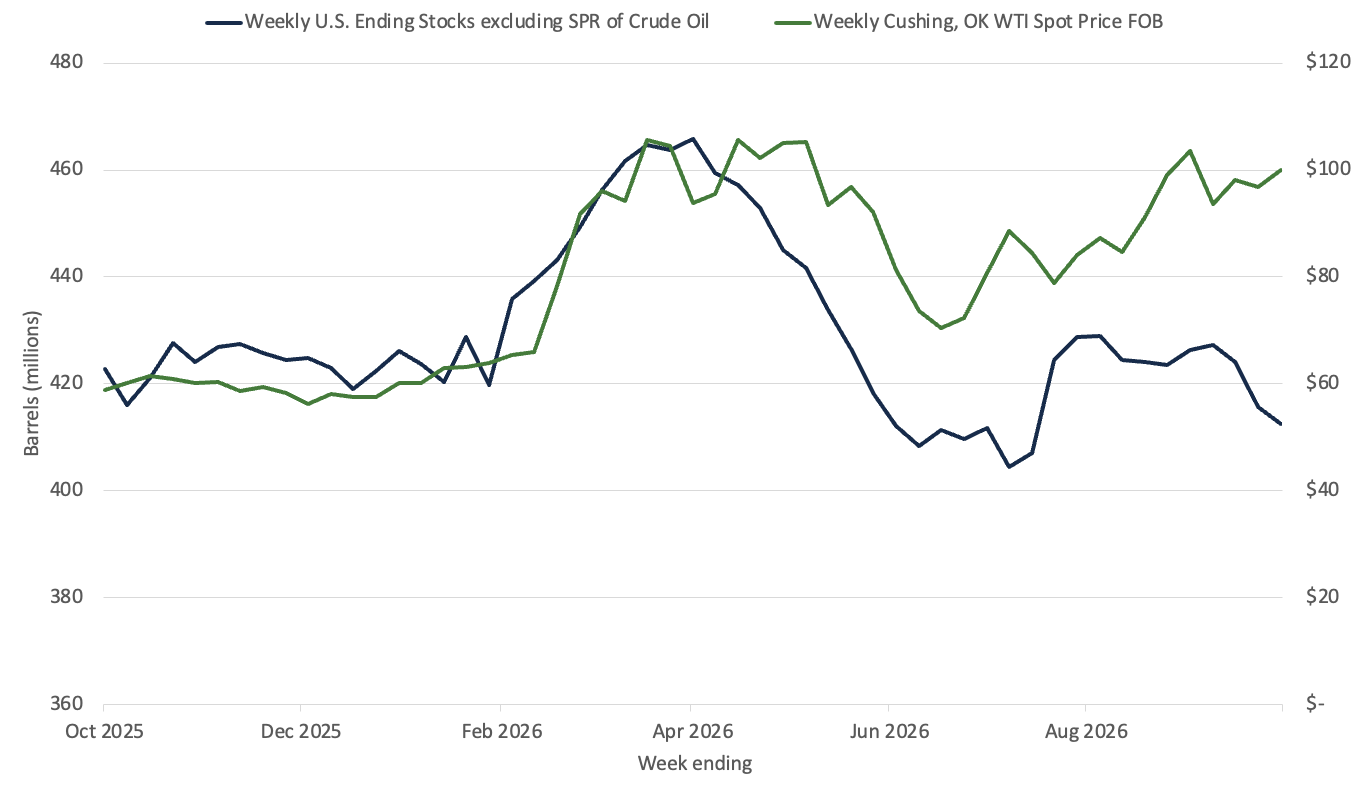
Chart takeaway: WTI prices are up 69.9% YoY despite only a 2.4% decrease in inventory, suggesting that inventory is only one component of price determination.
Our Reading of the Evidence
As a whole, the inventory evidence is moderately supportive of higher short-term oil prices, but it does not yet establish that the U.S. faces a sustained shortage. WTI’s significant year-over-year increase suggests that supply expectations warrant further consideration. Recent draws indicate some tightening in the market, but the implications for future prices remain reliant on the change in inventory relative to seasonal norms and broader supply and demand fundamentals.
The strongest alternative explanation is the geopolitical supply risk from the Iran conflict, which can raise WTI independently of U.S. stock levels. Trade flows offer an additional explanation. Elevated exports can reduce inventories without indicating a decline in production or an increase in consumption. Similarly, changes in import volume or refinery utilization can influence weekly stocks independently of global supply conditions.
Overall, the inventory evidence supports moderate tightening over our short-term horizon of 8-12 weeks, but does not necessarily establish a shortage.
Our Prediction - Michael
We believe that in the short run of 8-12 weeks, U.S. crude inventories will remain below the seasonal average, given refinery runs and a relatively constrained global supply market. However, we expect this deficit to reverse in mid-2027, when global supply recovers and imports from new sources of crude, namely Venezuela, fully materialise. Therefore, we expect U.S. crude inventories to fully recover to, if not exceed, seasonal averages by November 2027.
Petroleum Demand-Supply Dynamics (8-12 weeks)
In the short term, demand factors such as elevated refinery activity and heightened global distillate demand will increase the need for crude. US refinery utilisation is currently at 93.4%, significantly lower than its peak of 97.2%. The primary reason for this pullback is the scheduled refinery maintenance typical of the autumn season. We expect refinery utilisation to once again bounce back from this trough. Greater utilisation requires increased crude demand, presenting a headwind to crude inventory recovery.
We expect high utilisation to persist because of increased global distillate demand. Despite a rebound in crude supply, diesel has been slower to recover, as highlighted in our previous Oil and Gas analysis. Global middle distillate inventories will remain extremely constrained well into 2027, and distillate production has also decreased due to reduced refining activity. US refineries have picked up most of this slack, given the very high crack spread margins. Therefore, we expect high US refinery activity to hold, given the profitable refining margins on offer.
In addition, lower global distillate inventories imply greater US distillate exports. Already, in the first seven months of 2026, distillate exports increased 20% compared to 2025 and will likely continue to increase.
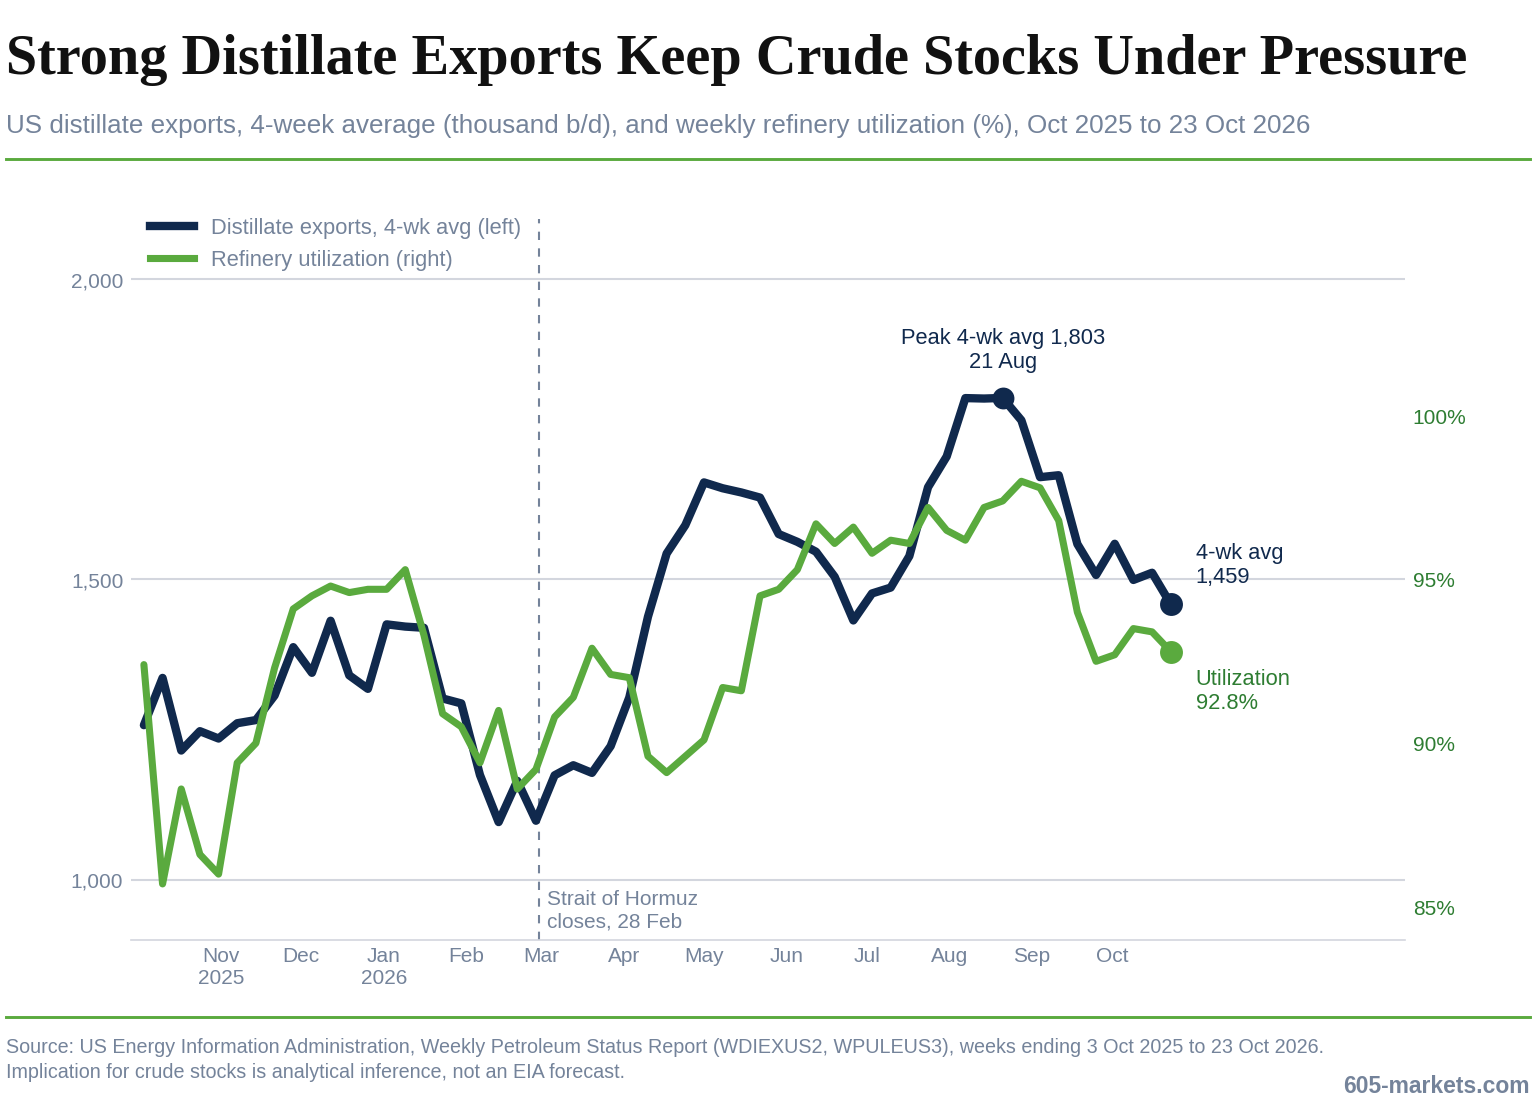
Ultimately, global crude supply is recovering, but distillate supply is not. With US refinery utilisation predicted to climb back towards a maximum, US crude inventories are unlikely to build in the short term as long as distillate exports remain elevated.
Petroleum Demand-Supply Dynamics (1-year)
In the long run, however, the trend shifts. We have observed that crude flows have recovered, but the main factor limiting US crude inventories has been high refining activity. High refining margins are derived mainly from decreased activity in Russia, and this is not a permanent disruption of distillate supply. While Russian refineries are being struck frequently, Russia’s ability to repair them will also increase. Given this assumption, as well as the importance of refining to the Russian economy, we expect that Russian distillate production and exports will eventually recover, increasing overall global distillate supply.
On the demand side, the IEA has projected seasonally lower gasoil and diesel demand for the remainder of 2026 and 1Q2027.
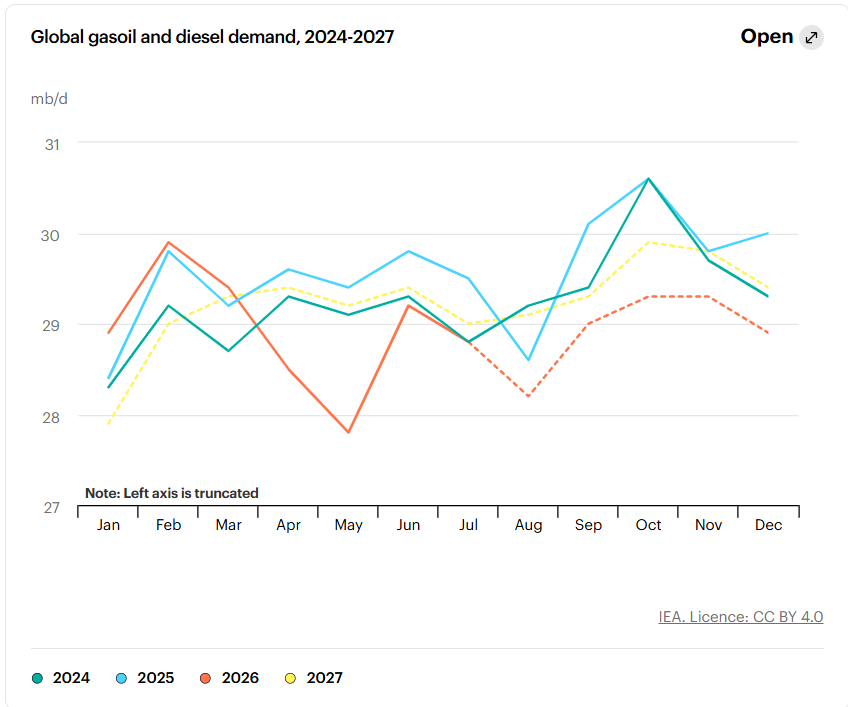
Lower distillate demand coinciding with a production recovery will drastically increase the availability of distillate inventories by the middle of 2027, and US refinery runs will normalise given weaker margins, significantly decreasing crude demand.
Venezuelan crude
Venezuela has regained its crude production capacity in 2026. The state oil company PDVSA recently reported an output of 1.252 mbpd, its highest level since 2019, while joint ventures such as Petrozamora and Chevron also experienced gains. Much of the growth has come from the Lake Maracaibo basin, where the country has historically extracted much of its crude.
Early in October, Venezuelan crude exports to the US amounted to a four-week average of 636,000 bpd, up 425% YoY. We expect crude production and exports to the US to continue to gradually increase, supported by the North American Blue Energy Partners (NABEP) deal. NABEP will gain concessions on 17 oil fields in Venezuela, with the US government gaining a 35% stake in its parent company. Realistically, there is still a significant amount of investment and modernisation needed to realise greater crude extraction, but it would support SPR refilling in the long run.
Most US refineries were built decades ago to process heavy, sour crude. While domestic US crude production has skyrocketed in recent years, much of it is lighter, sweeter crude, which is less efficiently processed by these refineries. Venezuela produces the heavy, sour crude that fits the needs of these refineries, and this will be a primary factor for increased US interest in Venezuela.
Therefore, while we don’t expect much material crude improvement in the short run, we believe that greater US interest in Venezuelan crude will somewhat assist US crude inventory recovery.
Inventory Outlook and Alternative Scenarios
| Scenario | Assumptions | Inventory |
|---|---|---|
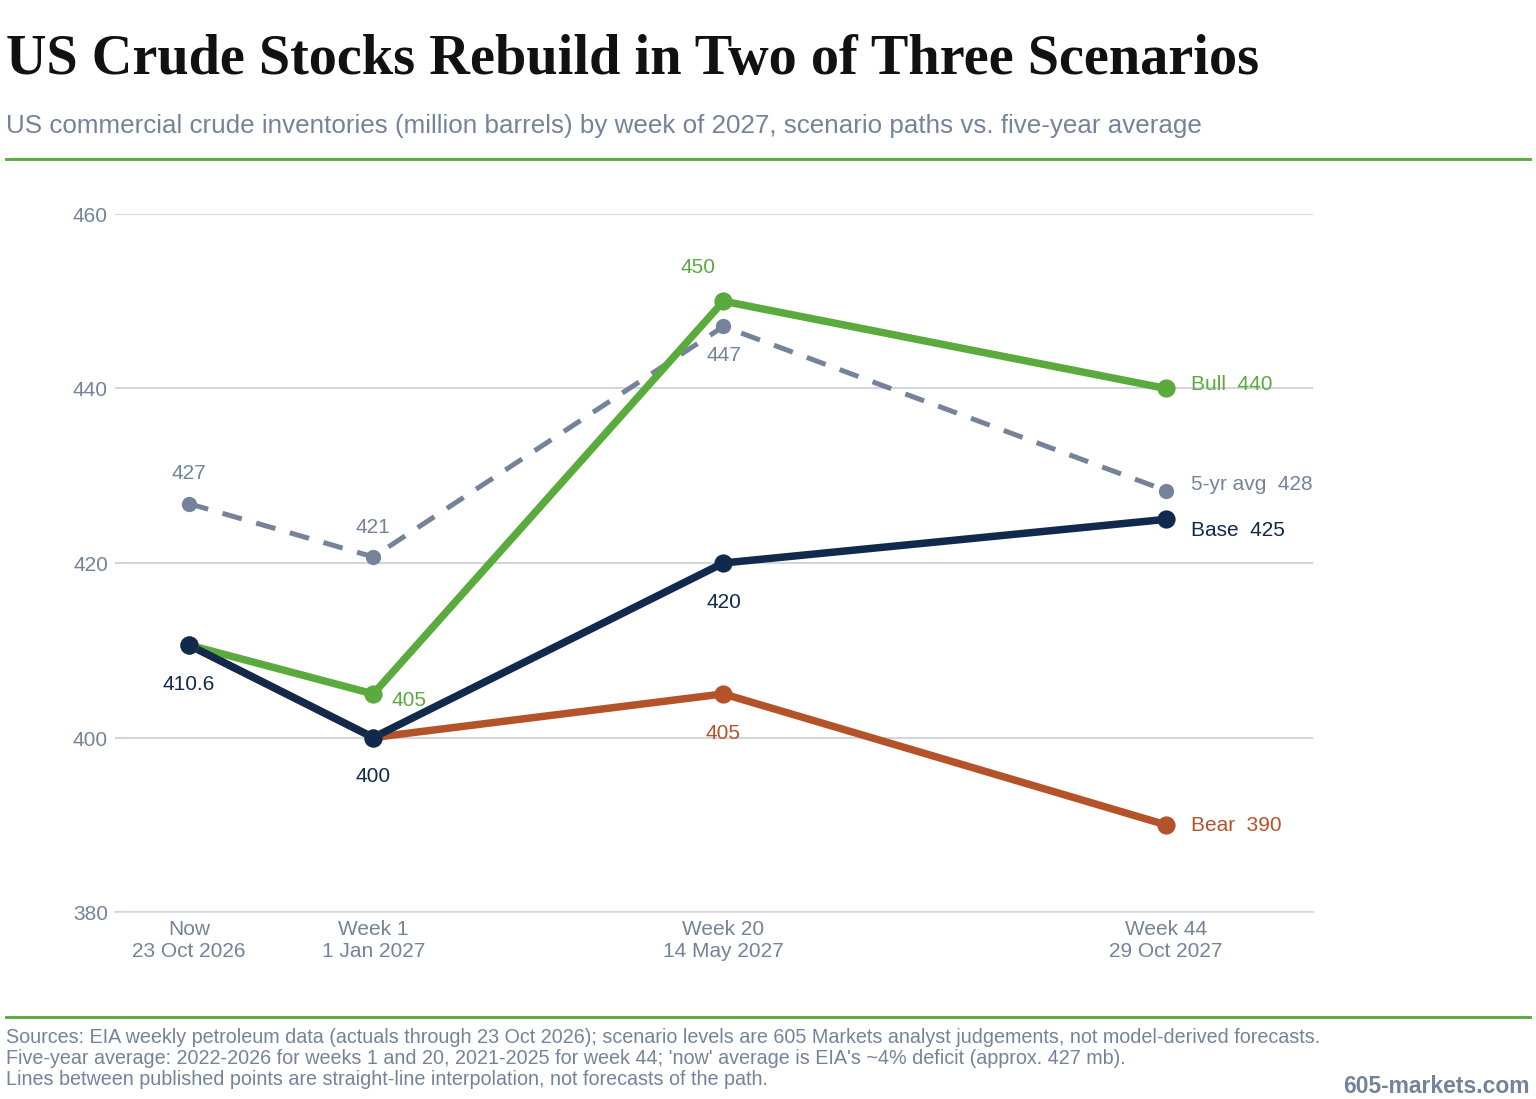
| Base | Middle East supply flow remains undisturbed, distillate stays tight through winter but gradually recovers. Refinery utilisation remains elevated. No significant Venezuelan crude export increases. | Draws end by 1Q27, and stocks build for the rest of 2027. 400 mb (Wk 1 ’27) (-33 average) 420 mb (Wk 20 ’27) (-27 average) 425 mb (Wk 44 ’27) (-3 average) |
| Bull | Middle East supply flow remains undisturbed, Russian refining recovers faster than expected, US distillate imports increase. Low US demand due to warm weather; US utilisation decreases. Venezuelan crude exports to the US slightly increase. | Draws end by early 2027, builds begin 1Q27, pushing inventory past seasonal supply averages. 405 mb (Wk 1 ’27) (-23 average) 450 mb (Wk 20 ’27) (+3 average) 440 mb (Wk 44 ’27) (+12 average) |
| Bear | Middle East flows are disrupted, Russian refineries remain damaged, US refining runs continue throughout 2027. | Draws continue throughout winter, and inventory remains below average; no build materialises. 400 mb (Wk 1 ’27) (-33 average) 405 mb (Wk 20 ’27) (-42 average) 390 mb (Wk 44 ’27) (-38 average) |
We will analyse three scenarios here. Under our base case, we have Middle East supply staying steady from its recovery. Most regional production will return to pre-conflict levels soon. There are no new disruptions, and distillate will stay tight throughout winter but will recover gradually as Russian refineries come back online. Because of this, refinery utilisation will stay elevated, so crude demand will stay steady throughout the winter. Venezuela will also contribute some crude, though not significantly.
Based on this, we expect around 400 mb, about 11 mb below today’s stock of 410.6 mb and the five-year average of ~421 mb. The reason for this dip is that we assume in all scenarios that there will still be some crude drawn due to the current diesel shortage. Once this reverses, less need for domestic crude and greater overall global crude supplies will bring inventories up to around 420 mb by week 20 (May 14). This corresponds to about a 27 mb deficit from seasonal averages. Ultimately, we predict a greater relative build-up between weeks 20 and 44 (Nov. 1) to 425 mb, or 3 mb below seasonal averages.
Overall, under our base case scenario, we predict this gradual build-up based on a decrease in demand back to around seasonal averages. For our bull and bear cases, we change the assumptions so that they lead to a faster build-up or no build-up, resulting in higher-than-normal inventories or continued deficits, respectively. For the bull, we assume an accelerated normalisation of inventories, with a seasonal drop between week 20 and week 44. For the bear, we assume long-term supply constraints will take a toll on inventories, especially during seasonal draws.
Conclusion - Michael
US commercial crude inventories are currently low due to elevated domestic refinery activity that is driven by tight global distillate markets and reduced net imports. Therefore, we cannot assume that this deficit compared to seasonal averages represents permanent domestic production losses.
Overall, over the next 8-12 weeks, sustained high refinery runs will keep commercial inventories below seasonal averages while providing moderate support to crude prices. As global distillate supply normalises and crude logistics stabilise in the Middle East, we will gain greater insight into how US crude inventories build up in 2027.
To further assess whether market tightness will persist, one should closely monitor US refinery utilisation rates to determine demand for crude. Any pullbacks in refining runs will serve as a primary catalyst for inventory rebuilding.
Data Sources
- https://www.oilpriceapi.com/data/inventory
- https://www.reuters.com/business/energy/opec-set-keep-oil-output-policy-unchanged-sunday-sources-say-2026-09-06/
- https://www.eia.gov/petroleum/supply/weekly/
- https://www.iea.org/reports/oil-market-report-october-2026
- https://www.criticalthreats.org/analysis/iran-update-october-16-2026-6ad2a89ed9d22
- https://www.eia.gov/dnav/pet/pet_pnp_unc_dcu_nus_m.htm
- https://www.eia.gov/dnav/pet/hist/LeafHandler.ashx?n=PET&s=WDIEXUS2&f=W
- https://www.industrialinfo.com/news/article/is-venezuelas-energy-sector-on-the-mend--363557
- https://www.telesurenglish.net/venezuela-oil-production/